NetApp Inc. ($NTAP) Stock: Q1 2026 Earnings and All-Flash Growth

2025/08/29 02:36

TLDR

  • Q1 revenue reached $1.56 billion, up 1% YoY, beating expectations.
  • All-flash array revenue rose 6% to $893 million, securing #1 market share.
  • Public cloud services grew 33% YoY excluding Spot.
  • Record cash flow from operations hit $673 million, free cash flow $620 million.
  • Shares dropped 6% after a cautious Q2 outlook.

NetApp Inc. (NASDAQ: NTAP) closed its first quarter of fiscal 2026 with revenue growth and all-flash leadership, yet shares fell nearly 6% in extended trading as guidance suggested slower spending ahead. As of August 27, 2025, the company reported Q1 results with revenue at $1.56 billion, up 1% year over year, while investors weighed market headwinds against operational strength. As of writing, shares trade at $114.26, up 1.90%.
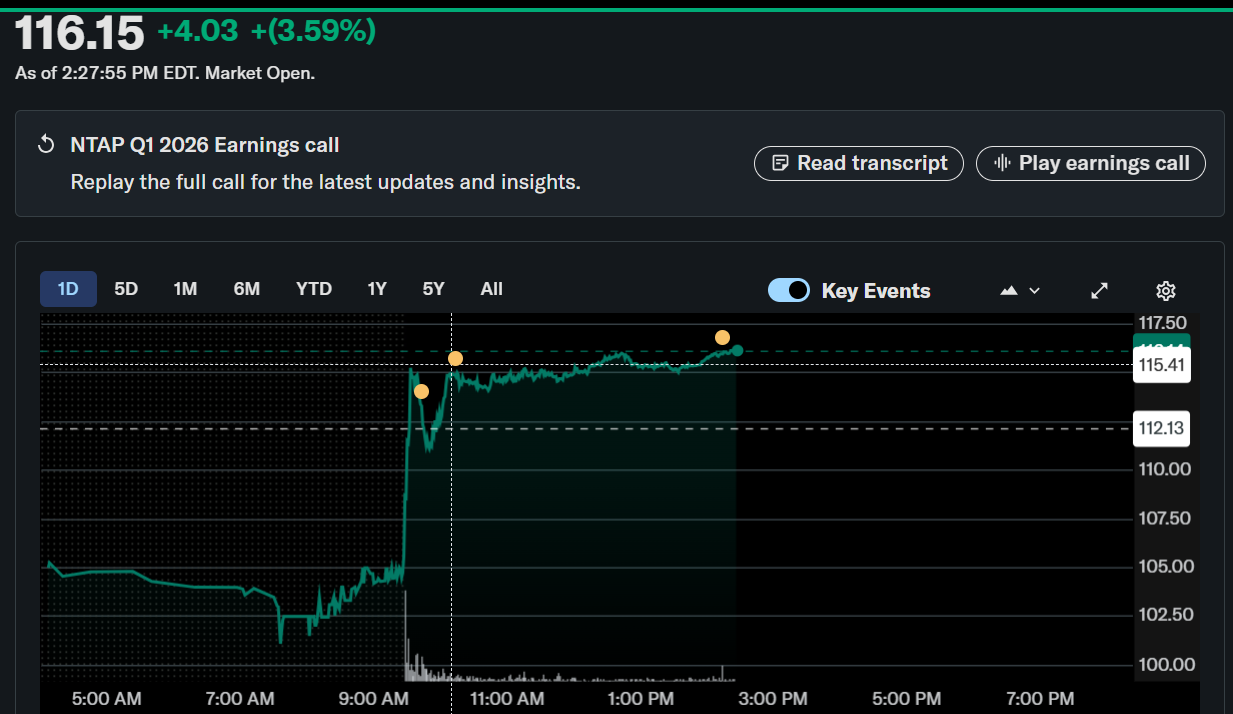
NetApp, Inc. (NTAP)

Quarterly Financial Performance

NetApp’s Q1 fiscal 2026 revenue of $1.56 billion surpassed analyst expectations of $1.55 billion. All-flash array revenue rose 6% year over year to $893 million, giving the company the top position in the all-flash market. Hybrid cloud revenue increased 1% to $1.40 billion, while public cloud revenue reached $161 million, also up 1% year over year but 18% growth when excluding Spot.

The company recorded a gross margin of 71.1%, improving 1.6 percentage points sequentially. Operating profit was $401 million with a margin of 25.7%. Non-GAAP diluted EPS came in at $1.55, while GAAP EPS was $1.15. Deferred revenue climbed 9% to $4.53 billion.

NetApp also returned $404 million to shareholders, including $300 million in buybacks and $104 million in dividends, or $0.52 per share. Cash and short-term investments totaled $3.3 billion, against $2.5 billion in debt, resulting in a net cash position of $840 million.

Guidance and Outlook

For Q2 fiscal 2026, NetApp expects revenue between $1.615 billion and $1.765 billion, with the midpoint slightly above consensus estimates of $1.68 billion. Adjusted EPS is projected between $1.84 and $1.94. For the full year, NetApp reaffirmed revenue guidance of $6.63 billion to $6.88 billion, with adjusted EPS expected in the range of $7.60 to $7.90.

Despite cautious guidance, management pointed to strong demand for AI-ready infrastructure and expanding partnerships with hyperscalers, including AWS, Google Cloud, and Microsoft Azure.

Strategic Highlights

The quarter was marked by significant innovation and partnerships. NetApp introduced its AIPod Mini with Intel, advancing AI adoption across industries. It also launched cyber-resilience features to address emerging threats and introduced BlueXP Keystone Management for subscription optimization.

In collaboration with NVIDIA and Microsoft, NetApp unveiled enterprise-grade RAG architecture and cloud integrations, strengthening its positioning in AI-driven data solutions. Awards and recognition reinforced its leadership, including being named #1 in all-flash storage by IDC and inclusion on the Forbes Global 2000 list.

Market Performance

Despite the operational achievements, NTAP shares declined after the earnings release. Year-to-date, the stock is nearly flat at -0.07%, while the S&P 500 gained 10.08%. Over one year, shares are down 11.7%, but the company has delivered strong long-term performance, with a three-year return of 63.6% and a five-year return of 183.5%, far outpacing the broader market.

NetApp’s leadership in all-flash and AI-ready infrastructure supports its long-term growth potential, though short-term revenue pressures remain a challenge.


The post NetApp Inc. ($NTAP) Stock: Q1 2026 Earnings and All-Flash Growth appeared first on CoinCentral.

Disclaimer: The articles reposted on this site are sourced from public platforms and are provided for informational purposes only. They do not necessarily reflect the views of MEXC. All rights remain with the original authors. If you believe any content infringes on third-party rights, please contact service@support.mexc.com for removal. MEXC makes no guarantees regarding the accuracy, completeness, or timeliness of the content and is not responsible for any actions taken based on the information provided. The content does not constitute financial, legal, or other professional advice, nor should it be considered a recommendation or endorsement by MEXC.
Share Insights

You May Also Like

Decoding the Crypto Fear & Greed Index: Why 50 is Crucial for Investors

Decoding the Crypto Fear & Greed Index: Why 50 is Crucial for Investors

BitcoinWorld Decoding the Crypto Fear & Greed Index: Why 50 is Crucial for Investors In the dynamic world of digital assets, understanding market sentiment is as vital as analyzing price charts. The Crypto Fear & Greed Index serves as a powerful barometer, offering a snapshot of investor psychology. Currently holding steady at 50, this key indicator signals a fascinating neutral stance in the market. But what exactly does this equilibrium mean for your crypto strategy? What Exactly is the Crypto Fear & Greed Index? The Crypto Fear & Greed Index is an essential tool designed to measure the prevailing emotional state of the cryptocurrency market. It ranges from 0 (extreme fear) to 100 (extreme greed). When investors are overly fearful, it can present a buying opportunity. Conversely, excessive greed might indicate a market correction is on the horizon. A score of 50, as we see today, suggests a balanced, neutral outlook among participants. This index provides a valuable perspective beyond just price movements. It helps you gauge whether the market is reacting emotionally or rationally. For instance, a sudden dip might cause widespread panic (fear), while a rapid surge could ignite FOMO (greed). The current neutral position of the Crypto Fear & Greed Index suggests neither extreme emotion is dominating. How is the Crypto Fear & Greed Index Calculated? Ever wondered what factors contribute to this insightful indicator? The Crypto Fear & Greed Index is not based on a single metric but a sophisticated combination of several market data points, each weighted differently to provide a comprehensive view. This multi-faceted approach ensures a more accurate reflection of sentiment. Here are the primary components that determine the index’s value: Volatility (25%): This measures the current volatility and maximum drawdowns of Bitcoin compared to its average values over the last 30 and 90 days. Higher volatility often indicates a fearful market. Market Momentum/Volume (25%): The current trading volume and market momentum are compared with average values. High buying volumes in a positive market often signal greed. Social Media (15%): This factor analyzes the number of posts and interactions related to cryptocurrencies on various social media platforms, especially Twitter. A surge in positive sentiment can push the index towards greed. Surveys (15%): While currently paused, surveys historically involved weekly polls to gather direct investor sentiment. This direct feedback offered unique insights. Bitcoin Dominance (10%): An increase in Bitcoin’s market cap dominance often suggests a shift from altcoins to Bitcoin, which can be a sign of fear or uncertainty in the broader altcoin market. Google Trends (10%): This component examines search query data for crypto-related terms. For example, a spike in searches for “Bitcoin price manipulation” might indicate fear. Decoding the Neutral Crypto Fear & Greed Index Reading A score of 50 on the Crypto Fear & Greed Index signifies a perfectly neutral market. This means neither extreme fear nor extreme greed is prevalent. Investors are not panicking, nor are they exhibiting irrational exuberance. Instead, the market is in a state of balance, weighing both positive and negative developments carefully. For many, a neutral reading can be a moment of introspection rather than immediate action. It suggests a period where the market might be consolidating or waiting for a clearer catalyst. This balanced sentiment could indicate a pause before a significant move in either direction, making it a crucial time for careful observation. Understanding this neutral Crypto Fear & Greed Index helps inform a measured approach. Actionable Insights: Navigating a Neutral Market with the Crypto Fear & Greed Index When the Crypto Fear & Greed Index sits at 50, what should investors consider? This neutral zone offers unique opportunities and challenges. It encourages a strategic, rather than emotional, approach to crypto investing. Benefits of a Neutral Market: Reduced Volatility: Often, a neutral index correlates with less drastic price swings, providing a calmer environment for analysis. Opportunity for Accumulation: Smart investors might use this period to gradually build positions in projects they believe in, without the pressure of extreme market emotions. Time for Research: It’s an excellent time to conduct thorough due diligence on various cryptocurrencies and emerging technologies. Challenges and Considerations: Lack of Clear Direction: A neutral market can sometimes feel stagnant, lacking obvious trends for short-term traders. Waiting Game: Patience becomes key, as significant price movements may not occur immediately. Vulnerability to News: The market can be more susceptible to sudden shifts based on major news events or regulatory announcements. In this neutral environment, focusing on long-term fundamentals and risk management becomes paramount. The Crypto Fear & Greed Index at 50 provides a chance to refine your strategy. Conclusion: The Enduring Value of the Crypto Fear & Greed Index The Crypto Fear & Greed Index, currently holding a neutral score of 50, remains an indispensable tool for anyone navigating the cryptocurrency markets. It distills complex market dynamics into a simple, understandable metric of investor sentiment. While it should not be the sole basis for investment decisions, it offers a powerful complementary perspective, helping you to identify potential overreactions or complacency. By understanding its components and what a neutral reading implies, you empower yourself to make more informed, less emotional choices. Keep an eye on the Crypto Fear & Greed Index; it’s a window into the collective psyche of the crypto world, guiding you through its unpredictable currents. Frequently Asked Questions (FAQs) What is the Crypto Fear & Greed Index? The Crypto Fear & Greed Index is a tool that measures the current emotional state of the cryptocurrency market, ranging from 0 (extreme fear) to 100 (extreme greed). It helps investors gauge whether the market is behaving rationally or emotionally. How is a “neutral” reading defined by the index? A neutral reading on the Crypto Fear & Greed Index, specifically a score of 50, indicates that neither extreme fear nor extreme greed is dominating the market. It suggests a balanced sentiment where investors are neither panicking nor exhibiting irrational exuberance. What factors influence the Crypto Fear & Greed Index? The index is calculated based on several factors, including market volatility, trading volume, social media sentiment, surveys (historically), Bitcoin’s market cap dominance, and Google search trends related to cryptocurrencies. Should investors make decisions solely based on the Crypto Fear & Greed Index? No, the Crypto Fear & Greed Index should be used as a complementary tool. While it provides valuable insight into market sentiment, it is crucial to combine it with fundamental analysis, technical analysis, and your own risk assessment before making any investment decisions. Where can I find the current Crypto Fear & Greed Index value? You can typically find the current value of the Crypto Fear & Greed Index on various cryptocurrency data websites and platforms, such as Alternative.me, which is a common source for this metric. Did you find this analysis of the Crypto Fear & Greed Index insightful? Share this article with your network on social media to help others understand market sentiment and make more informed decisions in the crypto space! To learn more about the latest crypto market trends, explore our article on key developments shaping Bitcoin price action. This post Decoding the Crypto Fear & Greed Index: Why 50 is Crucial for Investors first appeared on BitcoinWorld and is written by Editorial Team
Share
Coinstats2025/08/29 08:30
Share