The PerSense framework, a model-agnostic, one-shot, training-free method for customized instance segmentation in dense pictures, is described in this portion of the article. A Few-Shot Object Counter (FSOC) is used to generate density maps, an Instance Detection Module (IDM) is used to identify potential prompts, a Point Prompt Selection Module (PPSM) is used for adaptive filtering, and a Vision-Language Model (VLM) is used for semantic class-label extraction.The PerSense framework, a model-agnostic, one-shot, training-free method for customized instance segmentation in dense pictures, is described in this portion of the article. A Few-Shot Object Counter (FSOC) is used to generate density maps, an Instance Detection Module (IDM) is used to identify potential prompts, a Point Prompt Selection Module (PPSM) is used for adaptive filtering, and a Vision-Language Model (VLM) is used for semantic class-label extraction.

PerSense Delivers Expert-Level Instance Recognition Without Any Training

2025/10/29 03:37

Abstract and 1. Introduction

  1. Related Work

  2. Method

    3.1 Class-label Extraction and Exemplar Selection for FSOC

    3.2 Instance Detection Module (IDM) and 3.3 Point Prompt Selection Module (PPSM)

    3.4 Feedback Mechanism

  3. New Dataset (PerSense-D)

  4. Experiments

  5. Conclusion and References

A. Appendix

\

3 Method

We introduce PerSense, a training-free and model-agnostic one-shot framework designed for personalized instance segmentation in dense images (Figure 3). Here, we describe the core components of our PerSense framework, including Class-label extraction using vision-language model (VLM) and exemplar selection for few-shot object counter (FSOC) (sec. 3.1), instance detection module (IDM) (sec. 3.2), point-prompt selection module (PPSM) (sec. 3.3), and the feedback mechanism (sec. 3.4).

3.1 Class-label Extraction and Exemplar Selection for FSOC

PerSense operates as a one-shot framework, wherein a support set is utilized to guide the personalized segmentation of an object in the query image that shares semantic similarity with the support object. Initially, input masking is applied to the support image using the coarse support mask to isolate the object of interest. The resulting input masked image is fed into the VLM with a custom prompt, "Name the object in the image?". The VLM generates a description of the object in the image, from which the noun is extracted, representing the class-label or the object’s name. Subsequently, the grounding detector is prompted with this class-label to facilitate personalized object detection in the query image. To enhance the prompt, we prefixed the term "all" with the class-label.

\ Figure 4: (a) Without the identification of composite contours, multiple instances of the object may be considered as single contour (red circle). Identification of composite contours (green circle) enables to precisely localize child contours, resulting in improved segmentation performance. (b) The plot highlights the existence of composite contours beyond µ + 2σ , of the contour area distribution, for 250 images in PerSense-D. Hence, these contours can be identified and detected as outliers.

\ Next, we begin by computing the similarity score between query and support features coming from the encoder. Utilizing this score along with detections from the grounding object detector, we extract the positive location prior. Specifically, we identify the bounding box with the highest detection confidence and proceed to locate the pixel-precise point with the maximum similarity score within this bounding box. This identified point serves as the positive location prior, which is subsequently fed to the decoder for segmentation. Additionally, we extract the bounding box surrounding the segmentation mask of the object. This process effectively refines the original bounding box provided by the grounding detector. The refined bounding box is then forwarded as an exemplar to the FSOC for generation of Density Map (DM).

3.2 Instance Detection Module (IDM)

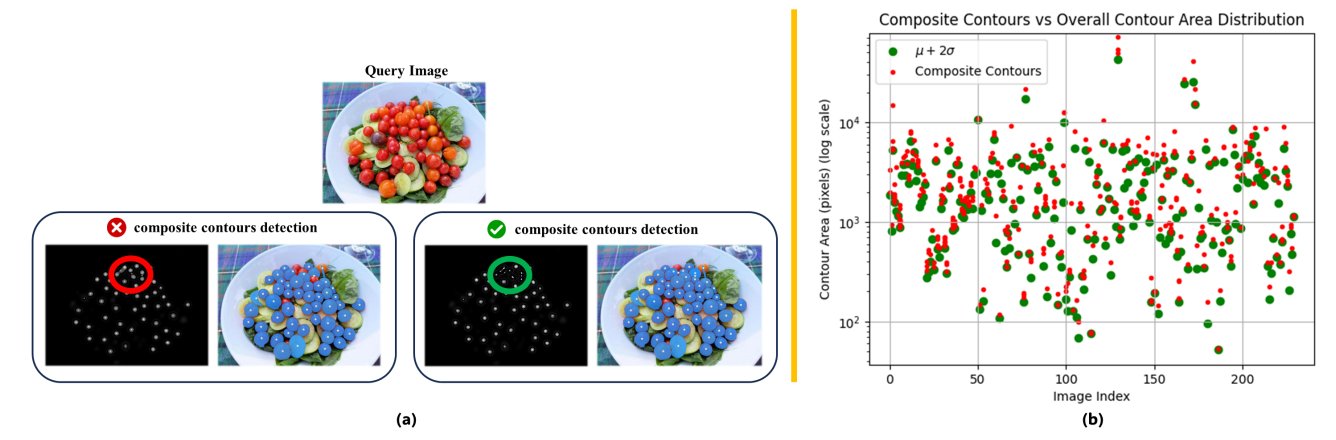
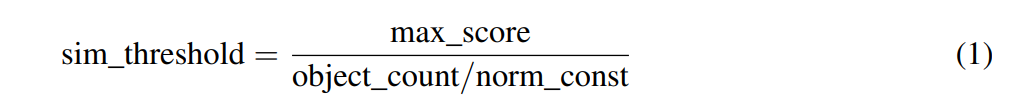
The IDM begins by converting the DM from FSOC into a grayscale image, followed by the creation of a binary image using a pixel-level threshold of 30 (range 0 to 255). Morphological erosion operation using a 3 x 3 kernel is then applied to refine the boundaries and eliminate noise from the binary image. We deliberately used a small kernel to avoid damaging the original densities of true positives. Next, contours are identified in the eroded binary image, and for each contour, its area and center pixel coordinates are computed. The algorithm calculates the mean (µ) and standard deviation (σ) of all contour areas to assess the distribution of contour sizes. Subsequently, composite contours, which represent multiple objects in one contour, are detected using a threshold based on the distribution of contour sizes. This is necessary to identify the regions which are detected as one contour but they encapsulate multiple instances of the object of interest (Figure 4a). Such regions are scarce and can be detected as outliers, essentially falling beyond µ + 2σ considering the contour size distribution (Figure 4b). For each detected composite contour, distance transform is applied to expose child contours for ease of detection. Finally, the algorithm returns the center points obtained from all detected contours (parent and child) as candidate point prompts. In summary, through systematic analysis of the DM, IDM identifies regions of interest and generates candidate point prompts, which are subsequently forwarded to PPSM for final selection. See Appendix A.1 for pseudo-code of IDM.

3.3 Point Prompt Selection Module (PPSM)

The PPSM serves as a critical component in the PerSense pipeline, tasked with filtering candidate point prompts for final selection. For each candidate point prompt received from IDM, we compare the corresponding query-support similarity score using an adaptive threshold as:

\

\ where maxscore is the maximum value of query-support similarity score, the objectcount corresponds to the number of instances of the desired object present in the query image and the normconst is a normalization factor to make the threshold adaptive with reference to the object count. We used a normalization factor of √ 2. A fixed similarity threshold would struggle in this case as query-support similarity score varies significantly even with small intra-class variations. Moreover, for highly crowded images (objectcount > 50), the similarity score for positive location priors can vary widely, necessitating an adaptive threshold that accounts for the density (count) of the query image. To address this challenge, our adaptive threshold is based on the maximum query-support similarity score as well as the object count within the query image. In addition to this, PPSM leverages the complementary bounding box information from the grounding detector and ensures that the filtered point prompt lies within the bounding box coordinates. Finally, the selected point prompts are fed to the decoder for segmentation. See Appendix A.1 for pseudo-code of PPSM.

3.4 Feedback Mechanism

PerSense also incorporates a feedback mechanism to enhance the exemplar selection process for FSOC by leveraging the initial segmentation output from the decoder. Based on the mask scores provided by SAM, the top four candidates, from the initial segmentation output, are selected and forwarded as exemplars to FSOC in a feedback manner. This leads to improved accuracy of the DM and consequently enhances the segmentation performance. The quantitative analysis of this aspect is further discussed in sec. 5, which explicitly highlights the value added by the feedback mechanism. See Appendix A.1 for the overall pseudo-code of PerSense.

\

:::info Authors:

(1) Muhammad Ibraheem Siddiqui, Department of Computer Vision, Mohamed bin Zayed University of AI, Abu Dhabi (muhammad.siddiqui@mbzuai.ac.ae);

(2) Muhammad Umer Sheikh, Department of Computer Vision, Mohamed bin Zayed University of AI, Abu Dhabi;

(3) Hassan Abid, Department of Computer Vision, Mohamed bin Zayed University of AI, Abu Dhabi;

(4) Muhammad Haris Khan, Department of Computer Vision, Mohamed bin Zayed University of AI, Abu Dhabi.

:::


:::info This paper is available on arxiv under CC BY-NC-SA 4.0 Deed (Attribution-Noncommercial-Sharelike 4.0 International) license.

:::

\

Disclaimer: The articles reposted on this site are sourced from public platforms and are provided for informational purposes only. They do not necessarily reflect the views of MEXC. All rights remain with the original authors. If you believe any content infringes on third-party rights, please contact service@support.mexc.com for removal. MEXC makes no guarantees regarding the accuracy, completeness, or timeliness of the content and is not responsible for any actions taken based on the information provided. The content does not constitute financial, legal, or other professional advice, nor should it be considered a recommendation or endorsement by MEXC.
Share Insights

You May Also Like

On-chain fee report for the first half of 2025: 1,124 protocols achieved profitability, with revenue exceeding $20 billion.

On-chain fee report for the first half of 2025: 1,124 protocols achieved profitability, with revenue exceeding $20 billion.

Author: 1kx network Compiled by: Tim, PANews 1kx has released its most comprehensive on-chain revenue report to date for the crypto market: the "1kx On-Chain Revenue Report (First Half of 2025)". The report compiles verified on-chain fee data from over 1,200 protocols, clearly depicting user payment paths, value flows, and the core factors driving growth. Why are on-chain fees so important? Because this is the most direct signal of genuine payment demand: On-chain ecosystem = open, global, and has investment value Off-chain ecosystem = restricted, mature Data comparison reveals development trends: on-chain application fees increased by 126% year-on-year, while off-chain fees only increased by 15%. How large is the market? In 2020, on-chain activity was still in the experimental stage, but by 2025 it will have developed into a real-time measurable $20 billion economy. Users are paying for hundreds of application scenarios: transactions, buying and selling, data storage, cross-application collaboration, and we have counted 1,124 protocols that have achieved on-chain profitability this year. How are the fees generated? DeFi remains a core pillar, contributing 63% of total fees, but the industry landscape is rapidly evolving: The wallet business (which surged 260% year-on-year) has transformed the user interface into a profit center. Consumer apps (200% growth) directly monetize user traffic. DePIN (which surged 400%) brings computing power and connectivity services onto the blockchain. Does the on-chain economy truly exist? Although the total cost did not exceed the 2021 peak, the ecological health is stronger than before: At that time, on-chain fees accounted for over 40% of ETH transactions; now, transaction costs have decreased by 86%. The number of profitable agreements increased eightfold. Token holders' dividends hit a record high What are the core driving factors? The asset price determines the on-chain fees denominated in USD, which is in line with expectations, but the following should be noted: Price fluctuations trigger seasonal cycles 21 years later, application costs and valuations show a strong causal relationship (increased costs drive up valuations). The influence of on-chain factors in specific tracks is significant. Who is the winner? The top 20 protocols account for 70% of the total fees, but the rankings change frequently, as no industry can be disrupted as rapidly as the crypto space. The top 5 are: meteora, jito, jupitter, raydium, and solana. A discrepancy exists between expenses and valuation: Although application-based projects dominate expense generation, their market capitalization share has remained almost unchanged. Why is this? The market's valuation logic for application-based projects is similar to that for traditional enterprises: DeFi has a price-to-earnings ratio of about 17 times, while public chains have a valuation as high as 3900 times, which reflects additional narrative value (store of value, national-level infrastructure, etc.). What are the future trends for on-chain fees? Our baseline forecast shows that on-chain fees will exceed $32 billion in 2026, representing a year-on-year increase of 63%, primarily driven by the application layer. RWA, DePIN, wallets, and consumer applications are entering a period of accelerated development, while L1 fees will gradually stabilize as scaling technology continues to advance. Driven by favorable regulations, we believe this marks the beginning of the crypto industry's maturity phase: application scale, fee revenue, and value distribution will eventually advance in tandem. Full version: https://1kx.io/writing/2025-onchain-revenue-report
Share
PANews2025/10/31 16:43
IP Hits $11.75, HYPE Climbs to $55, BlockDAG Surpasses Both with $407M Presale Surge!

IP Hits $11.75, HYPE Climbs to $55, BlockDAG Surpasses Both with $407M Presale Surge!

The post IP Hits $11.75, HYPE Climbs to $55, BlockDAG Surpasses Both with $407M Presale Surge! appeared on BitcoinEthereumNews.com. Crypto News 17 September 2025 | 18:00 Discover why BlockDAG’s upcoming Awakening Testnet launch makes it the best crypto to buy today as Story (IP) price jumps to $11.75 and Hyperliquid hits new highs. Recent crypto market numbers show strength but also some limits. The Story (IP) price jump has been sharp, fueled by big buybacks and speculation, yet critics point out that revenue still lags far behind its valuation. The Hyperliquid (HYPE) price looks solid around the mid-$50s after a new all-time high, but questions remain about sustainability once the hype around USDH proposals cools down. So the obvious question is: why chase coins that are either stretched thin or at risk of retracing when you could back a network that’s already proving itself on the ground? That’s where BlockDAG comes in. While other chains are stuck dealing with validator congestion or outages, BlockDAG’s upcoming Awakening Testnet will be stress-testing its EVM-compatible smart chain with real miners before listing. For anyone looking for the best crypto coin to buy, the choice between waiting on fixes or joining live progress feels like an easy one. BlockDAG: Smart Chain Running Before Launch Ethereum continues to wrestle with gas congestion, and Solana is still known for network freezes, yet BlockDAG is already showing a different picture. Its upcoming Awakening Testnet, set to launch on September 25, isn’t just a demo; it’s a live rollout where the chain’s base protocols are being stress-tested with miners connected globally. EVM compatibility is active, account abstraction is built in, and tools like updated vesting contracts and Stratum integration are already functional. Instead of waiting for fixes like other networks, BlockDAG is proving its infrastructure in real time. What makes this even more important is that the technology is operational before the coin even hits exchanges. That…
Share
BitcoinEthereumNews2025/09/18 00:32