

Bitcoin On-Chain Activity Hits 2-Year Lows as BTC Reclaims Ground
Bitcoin’s on-chain activity has dropped to two-year lows even as BTC reclaims ground above $80,000, creating a notable disconnect between price strength and network participation that has caught the attention of multiple analytics firms.
On-chain analytics platform Santiment reported on May 4 that Bitcoin’s network usage had fallen to its lowest levels in two years, with just 531K wallets making daily transfers and 203K new wallets being created each day. The decline came even as BTC returned above $80K for the first time in three months.
The price recovery itself has been substantial. Bitcoin has climbed roughly 22% over the past five weeks, yet the network’s base layer tells a different story. Current recommended fees sit at just 2 sat/vB for fastest confirmation, while daily transaction counts hover around 572,197, both consistent with muted demand for block space.
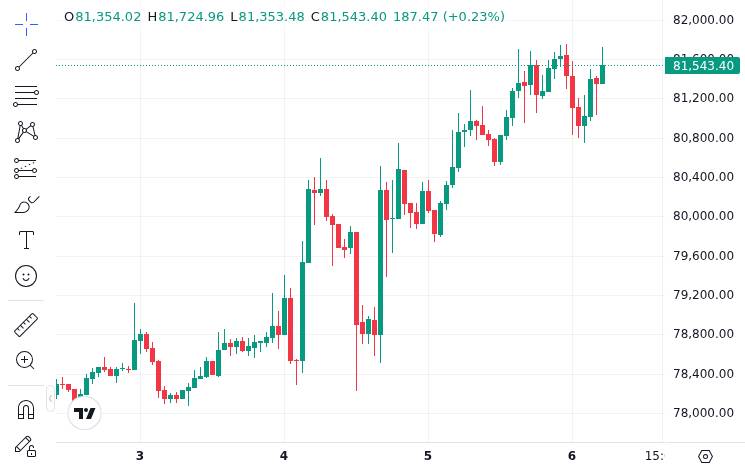 CoinMarketCap market snapshot used to anchor the spot-price section for bitcoin.
At press time, BTC traded at $81,663 with a market capitalization of roughly $1.63 trillion and 24-hour volume near $41.8 billion. The Fear & Greed Index registered 46, placing overall sentiment in “Fear” territory despite the price recovery.
Why BTC Can Rally While the Network Stays Quiet
On-chain activity and price can diverge for extended periods. A rally driven primarily by spot ETF demand, derivatives positioning, or concentrated large-holder accumulation does not necessarily generate the broad wallet-level activity that retail participation produces.
Glassnode noted in its latest weekly pulse that “ETF demand remains strong, while on-chain activity cools, signaling consolidation with improving sentiment.” This framing suggests the current move is being powered by institutional channels that route through custodians and funds rather than individual on-chain wallets.
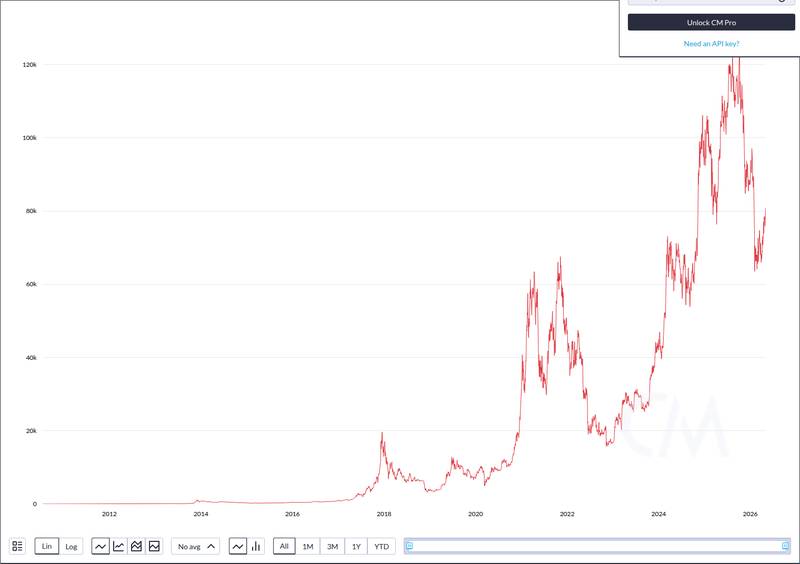 CoinMetrics dataset included to support the central evidence line for bitcoin.
The disconnect is not unprecedented. Previous cycles have seen price lead on-chain participation, with network metrics catching up only after sustained price strength draws new users back. However, Santiment cautioned that low network activity during a price rally can also signal a move that “lacks a strong foundation,” though this remains an interpretive judgment rather than a confirmed outcome.
The situation also contrasts with developments in other areas of the crypto market. The KelpDAO migration to Chainlink CCIP and GoMining’s launch of GoBTC both reflect active on-chain deployment, underscoring that the quiet-network dynamic is specific to Bitcoin’s base layer rather than a crypto-wide phenomenon.
What Signals Would Confirm or Challenge This Rally
For Bitcoin’s price recovery to gain stronger footing, analysts will watch for a rebound in daily active addresses above the current 531K level and a pickup in new wallet creation beyond 203K per day. A sustained return of fee pressure above the current 2 sat/vB floor would indicate genuine demand for block space.
The upcoming CME Group Bitcoin volatility futures launch on June 1 could introduce new hedging dynamics that influence both price and participation metrics. Whether institutional demand continues to compensate for retail absence will likely determine if this divergence resolves upward or corrects.
If on-chain metrics remain suppressed while price holds, the market may be entering a phase where off-chain vehicles like ETFs effectively decouple spot price from base-layer usage, a structural shift that would redefine how analysts interpret network health signals going forward.
Disclaimer: This article is for informational purposes only and does not constitute financial or investment advice. Cryptocurrency and digital asset markets carry significant risk. Always do your own research before making decisions.


Ayrıca Şunları da Beğenebilirsiniz

Pi Network Founders Take the Stage at Consensus 2026 Miami

Whale Bets Big On ZEC And HYPE With 10x Leverage


