Ethereum price forms bearish Adam and Eve pattern, will it crash under $2,000?
Ethereum price continued moving lower on Monday as rising macroeconomic uncertainty, weakening institutional demand, and growing exchange inflows pressured the broader crypto market.
- Ethereum price fell more than 5% toward $2,100 as spot ETH ETFs recorded roughly $255 million in weekly outflows and market sentiment weakened.
- Major crypto market makers, including Wintermute, reportedly reduced Ethereum exposure, while ETH exchange inflows climbed to their highest levels since early 2025.
- Ethereum formed a bearish Adam and Eve pattern on the daily chart, with a breakdown below $1,930 potentially opening the door to deeper losses.
According to data from crypto.news, Ethereum (ETH) price fell more than 5% over the past 24 hours to trade near $2,120 at press time. Despite recovering strongly from its February lows earlier this year, the token remains more than 35% below its yearly high near $3,350.
Several bearish catalysts now appear to be weighing on Ethereum’s short-term outlook.
First, institutional sentiment toward Ethereum has weakened considerably in recent sessions. Data from SoSoValue shows that U.S.-listed spot Ethereum ETFs extended their recent outflow streak last week, with roughly $255 million exiting the funds as institutional appetite across the broader crypto market deteriorated.
At the same time, top crypto market makers have also started reducing exposure to the asset. Recent reports indicate that major trading firms such as Wintermute have offloaded nearly 40% of their Ethereum holdings over the past few weeks, adding additional sell-side pressure to the market.
Ethereum’s on-chain exchange flows have also turned increasingly bearish.
Net ETH inflows into centralized exchanges recently climbed to their highest levels since early 2025, often a signal that traders may be preparing to sell tokens rather than hold them in private wallets. Investors have additionally remained cautious following several large ETH transfers linked to early Ethereum insiders and co-founders moving funds to exchanges such as Kraken.
Meanwhile, rising inflation concerns and elevated oil prices have continued pressuring risk assets globally.
On the daily chart, Ethereum now appears to be forming a bearish Adam and Eve topping pattern, a technical structure that often signals a potential trend reversal following a failed recovery attempt.
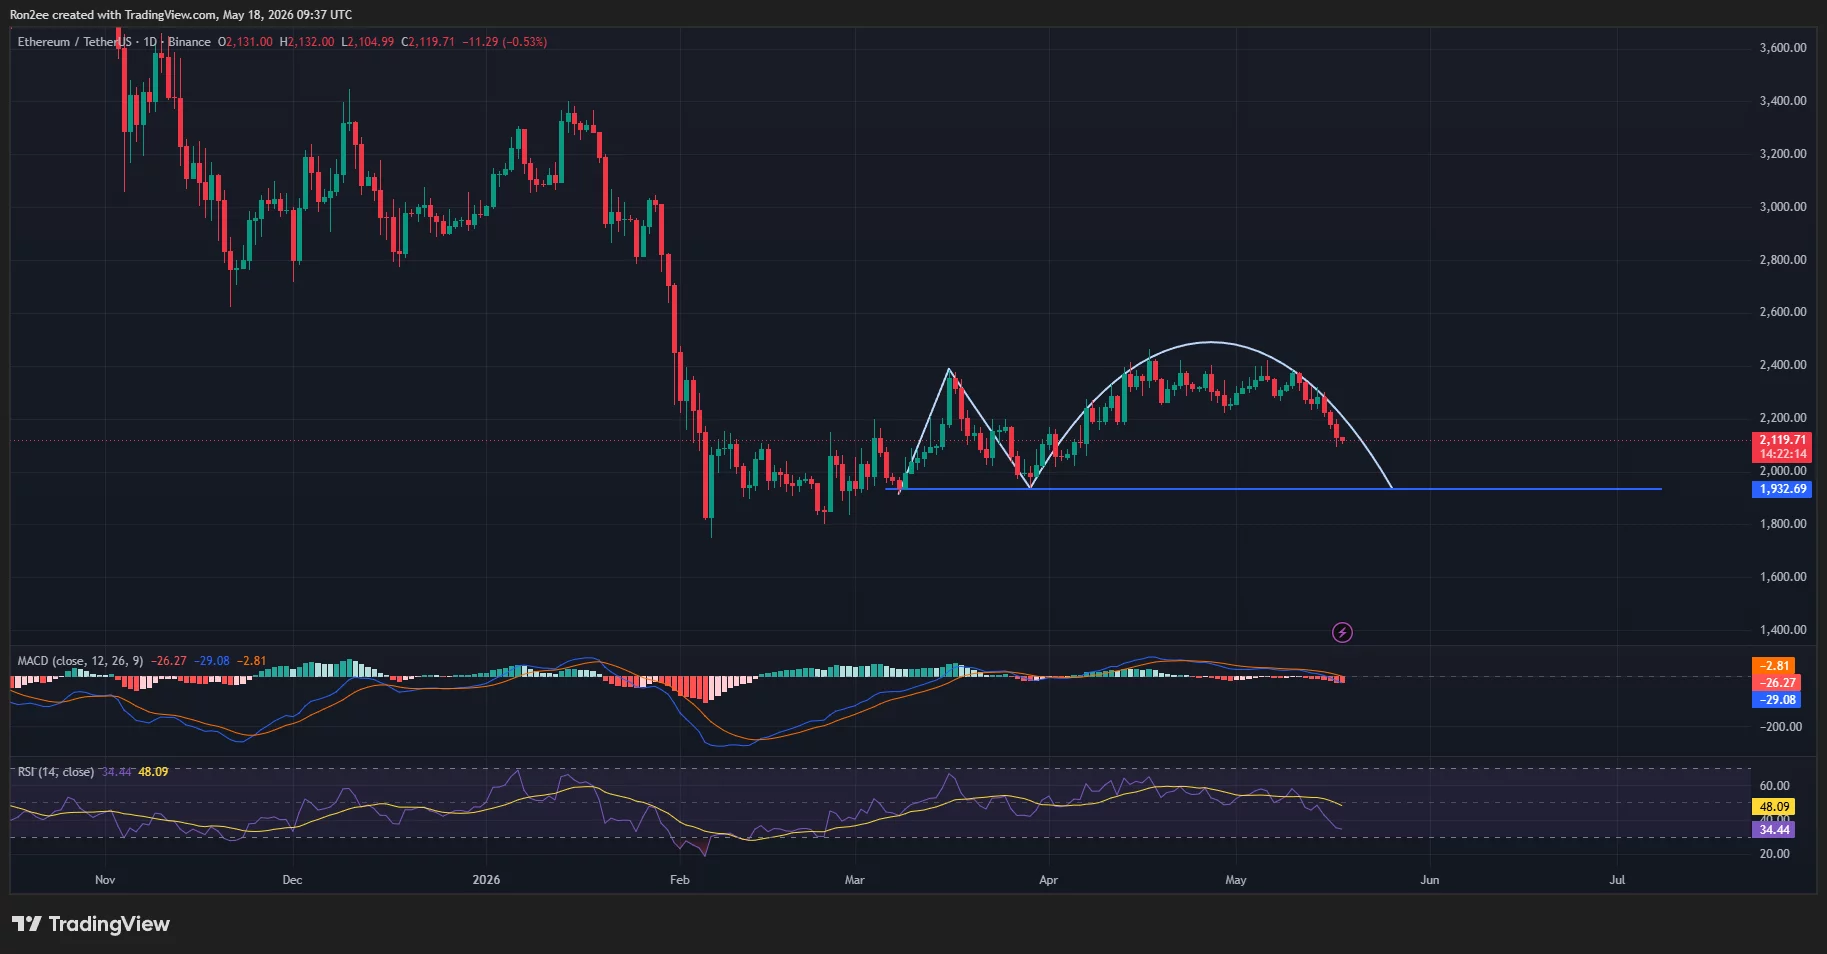
The pattern consists of a sharp, rounded peak followed by a broader, curved structure, with the neckline support currently positioned near the $1,930 region.
Ethereum has already started breaking down from the upper curve of the formation, while momentum indicators continue weakening.
The MACD has crossed into bearish territory, with both signal lines continuing to trend lower as red histogram bars expand, indicating growing downside momentum.
Meanwhile, the RSI has fallen toward the 34 level, suggesting that bearish momentum continues strengthening while buyers gradually lose control of the short-term trend.
Ethereum is also now struggling to hold above the key $2,100 psychological support level after repeatedly failing to reclaim the $2,400 resistance zone earlier this month.
If sellers successfully push ETH below the neckline support near $1,930, the bearish Adam and Eve setup could trigger a deeper correction toward the $1,700–$1,600 region.
On the upside, bulls would need to reclaim the $2,300–$2,400 resistance zone to invalidate the current bearish structure and restore broader bullish momentum.
Disclosure: This article does not represent investment advice. The content and materials featured on this page are for educational purposes only.


Ayrıca Şunları da Beğenebilirsiniz

Standard Chartered moves to acquire Zodia Custody, integrating crypto services

Trillion-Dollar Italian Bank Moves To XRP, But How Much Have They Bought?