Ethereum price stuck near $2,100 as volume jumps 38% into sell-off

Risk-off flows leave Ethereum price hovering near 2,119 as the May range floor comes under pressure, with volatility building outside the daily lower Bollinger Band.
The dominant force is defensive positioning: BTC dominance 58.3% as total crypto market cap fell 1.8% in 24h, while the Fear & Greed Index at 28 (Fear). Moreover, volume jumped 38% into the drop, a sign of pressured selling rather than healthy accumulation.
Main scenario (D1): Bearish — the daily structure is down, and rallies face layered resistance overhead. However, any bounce is tactical until ETH can reclaim key daily levels.
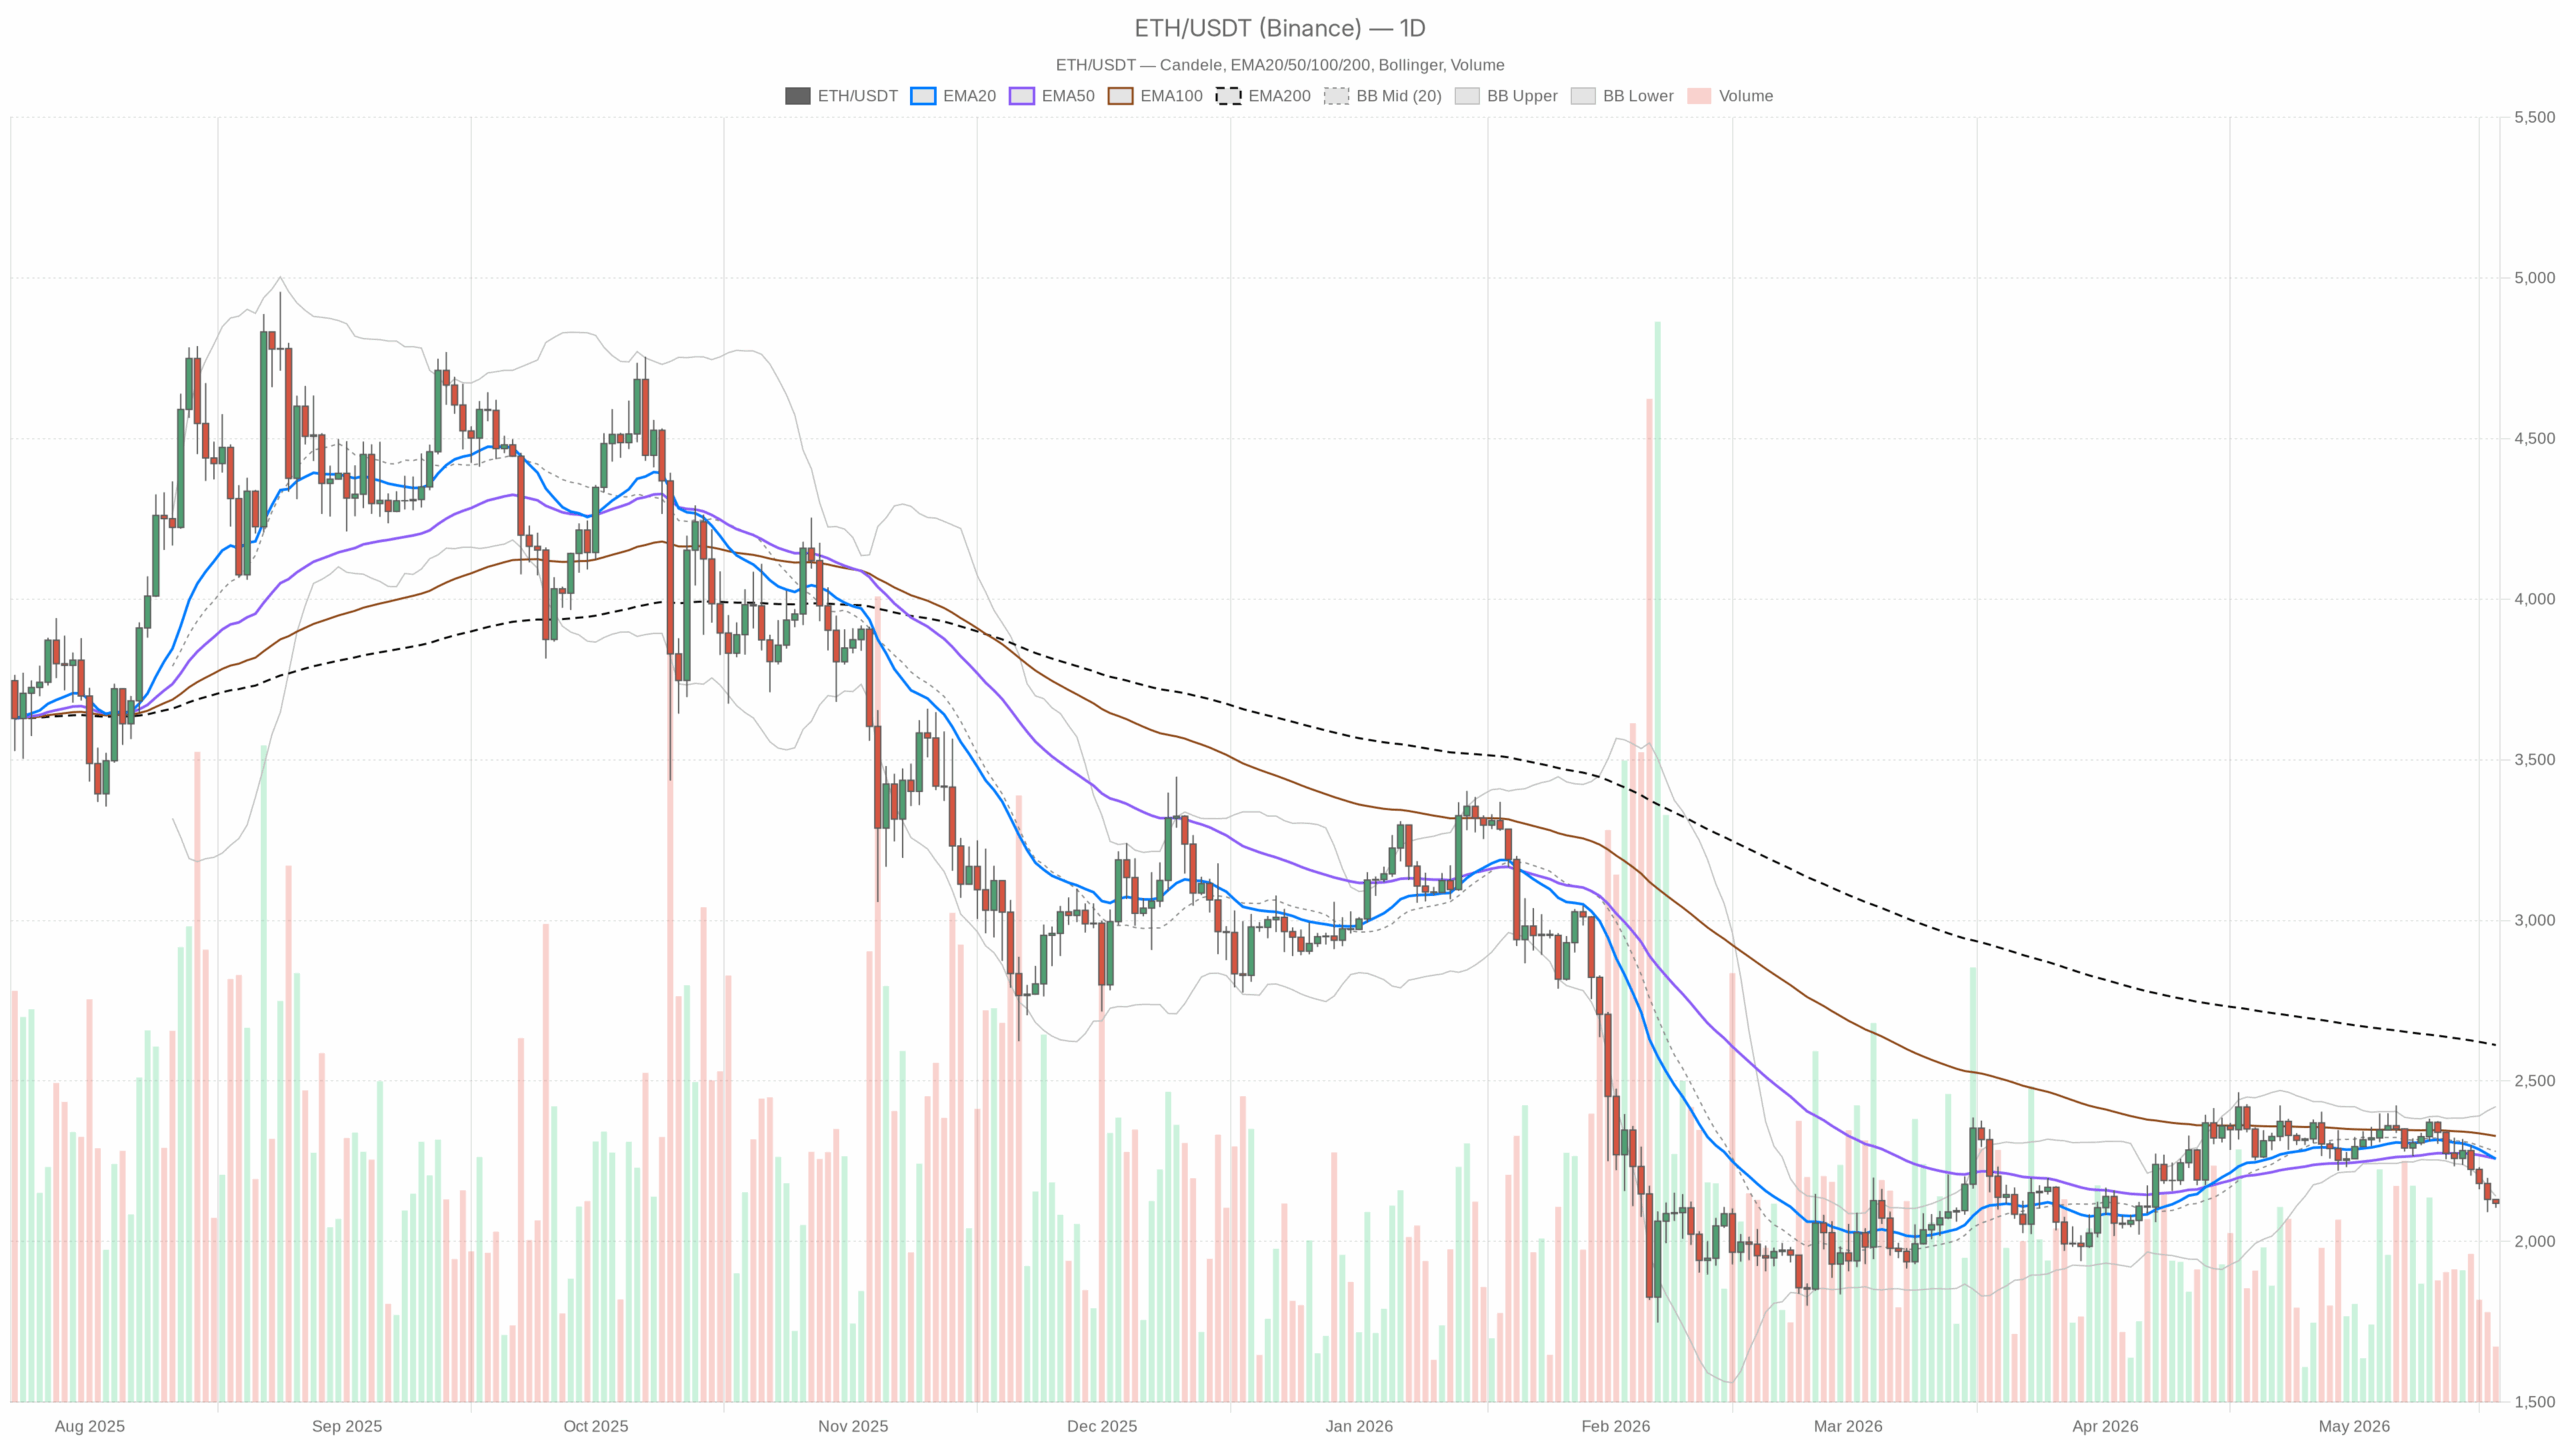 ETH/USDT — daily chart with candlesticks, EMA20/EMA50 and volume.
Daily chart (macro bias)
- EMA stack: price 2,118.9 sits below EMA20 2,257.3, EMA50 2,258.0, and EMA200 2,611.7. It is firmly under all trend markers, and the 20/50 EMAs compress into a heavy supply zone overhead.
- RSI(14): 34.4. Momentum is weak but not fully washed out. Sellers still control the tape, yet a snapback is plausible.
- MACD: line -29.1 vs signal -2.8, histogram -26.3. Downside momentum remains dominant. The bear impulse has not meaningfully cooled.
- Bollinger Bands: mid 2,280.6, upper 2,420.0, lower 2,141.2. Price trades below the lower band, stretching conditions that often invite mean reversion. In downtrends, this can precede another leg lower.
- ATR(14): 71.5. That implies roughly a 70-point daily swing. Volatility is elevated enough to punish late entries in either direction.
- Pivots: PP 2,118.6, R1 2,132.3, S1 2,105.3. Price is hugging the pivot. Losing S1 would hand bears control intraday, while a push above R1 only neutralizes immediate pressure.
1H chart (confirmation/pressure gauge)
- EMA20/50/200: 2,142.5 / 2,170.2 / 2,240.9 with price below all. The intraday trend is down, and rallies into 2,142–2,170 are likely sold on first test.
- RSI(14): 26.7 — intraday oversold. A bounce attempt is likely, but it is counter-trend.
- MACD: line -18.7 vs signal -16.6, histogram -2.1. It is still negative, but the histogram is small. Selling pressure may be easing, not reversing.
- Bollinger Bands: mid 2,150.2, lower 2,083.4. Price sits in the lower half. A slip through 2,105 risks a run at 2,083.
- ATR(14): 16.9 — typical hourly swings near 17 points. Expect whipsaws around the pivot cluster.
- Pivots: PP 2,118.9, R1 2,121.9, S1 2,116.0. These are micro levels for timing. Reclaiming R1 would squeeze into 2,127–2,132.
15m chart (execution context)
- EMA20/50/200: 2,120.3 / 2,132.0 / 2,169.8. Price is flirting with the 20-EMA but still beneath higher anchors. Micro-bounces face resistance quickly.
- RSI(14): 45.5 — neutral; there is room both ways.
- MACD: histogram positive. Very short-term momentum is turning up, consistent with an oversold bounce attempt.
- Bollinger Bands: mid 2,119.6; price near the mid. Coiling follows a push lower, not yet a trend change.
- ATR(14): 5.5. This is a small scalper’s range. Noise can look like signal on this timeframe.
- Pivots: PP 2,118.2, R1 2,120.1, S1 2,117.3. These are tiny levels. Acceptance above 2,120 would open a test of 2,125–2,132.
Market context and flows
- BTC dominance: 58.3% — capital is hiding in BTC; historically a headwind for ETH outperformance.
- Fear & Greed: 28 (Fear) — risk appetite is low; dip-buying is more selective and fragile.
- DeFi fees: Uniswap V3 30d -53.3%, V4 -41.9%, Curve -48.8% — softer on-chain activity reduces organic ETH demand; rallies lack fundamentals to extend.
Scenarios
Bullish (tactical mean reversion): Given the lower-band breach, Ethereum price may attempt a snapback if it holds above 2,105–2,110 and reclaims 2,132 (daily R1). An hourly close above the 1H EMA20 at 2,142 and continuation toward 2,170 (1H EMA50) would confirm a squeeze. Initial targets: 2,150–2,180; stretch target: 2,200–2,220. A daily close back inside the band strengthens the case for a run at the 2,250–2,260 EMA20/50 cluster.
Invalidation: A daily close below 2,100 or an impulsive break under 2,083 (1H lower band). That would indicate trend continuation, not reversion.
Bearish (trend continuation): Failures below 2,132 followed by a breakdown through 2,105/2,100 open 2,083 next, then 2,050 and the psychological 2,000 handle. Persistent rejection at 2,142–2,170 (1H EMAs) keeps rallies as opportunities to sell into strength.
Invalidation: A sustained reclaim of 2,141–2,150 with 1H closes above 2,142 and follow-through above 2,170. Later, a daily close above 2,180 would weaken the downside bias.
How to think about positioning now
The daily trend is down and fear is elevated, so the default bias is to fade strength while ETH trades below the 2,200 area and the 20/50-day EMAs. That said, there is room for a bounce given the lower-band breach and oversold intraday readings. Without reclaiming 2,141–2,170 and converting those into support, rallies look like relief rather than reversal.
Moreover, volatility is non-trivial, with daily ATR ~70. Risk should be sized for sharp two-way swings and the possibility of failed breakouts.
Bottom line: Above 2,141/2,170 opens a squeeze, while below 2,105/2,100 reopens the path to 2,083 -> 2,050 -> 2,000. Respect the bearish daily structure and allow for tactical mean reversion attempts, then let the levels do the talking.


Ayrıca Şunları da Beğenebilirsiniz

The $55 Oil Trade Is Still on the Table, but Brent’s Chart Has Conditions

'Lipstick on a pig': Behind Trump's bombastic claims lies a trail of failed initiatives