XRP Price Under Pressure Again, Traders Brace For More Weakness
XRP price extended losses and traded below $1.40. The price is now consolidating losses and faces hurdles near $1.3650 and $1.3940.
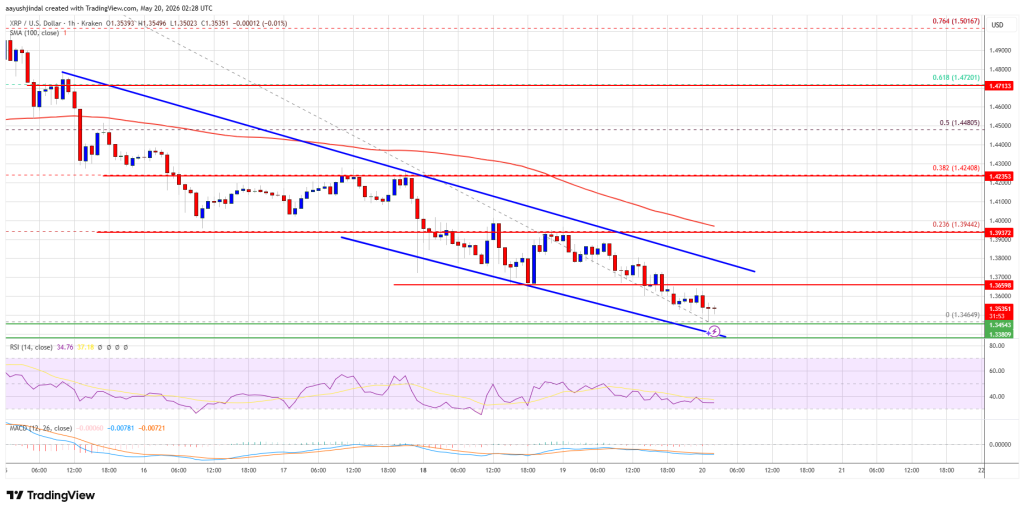
- XRP price started another decline and traded below the $1.40 zone.
- The price is now trading below $1.3880 and the 100-hourly Simple Moving Average.
- There is a bearish trend line forming with resistance at $1.3720 on the hourly chart of the XRP/USD pair (data source from Kraken).
- The pair could continue to move down if it stays below $1.40.
XRP Price Dips Below $1.40
XRP price failed to stay above $1.4150 and extended its decline, like Bitcoin and Ethereum. The price declined below $1.4050 and $1.40 to enter a short-term bearish zone.
The price even extended losses below $1.380. A low was formed at $1.3464, and the price is now consolidating losses well below the 23.6% Fib retracement level of the downward move from the $1.5495 swing high to the $1.3464 low.
The price is now trading below $1.3880 and the 100-hourly Simple Moving Average. If there is a fresh recovery move, the price might face resistance near the $1.3650 level. There is also a bearish trend line forming with resistance at $1.3720 on the hourly chart of the XRP/USD pair.
The first major resistance is near the $1.380 level. The main resistance could be $1.3940. A close above $1.3940 could send the price to $1.40. The next hurdle sits at $1.4250 or the 50% Fib retracement level of the downward move from the $1.5495 swing high to the $1.3464 low.
A clear move above the $1.4250 resistance might send the price toward the $1.440 resistance. Any more gains might send the price toward the $1.450 resistance.
More Losses?
If XRP fails to clear the $1.40 resistance zone, it could start a fresh decline. Initial support on the downside is near the $1.3465 level. The next major support is near the $1.3350 level.
If there is a downside break and a close below the $1.3350 level, the price might continue to decline toward $1.3220. The next major support sits near the $1.320 zone, below which the price could continue lower toward $1.3120.
Technical Indicators
Hourly MACD – The MACD for XRP/USD is now gaining pace in the bearish zone.
Hourly RSI (Relative Strength Index) – The RSI for XRP/USD is now below the 50 level.
Major Support Levels – $1.3465 and $1.3350.
Major Resistance Levels – $1.3720 and $1.3940.


Ayrıca Şunları da Beğenebilirsiniz

Inspired Voyager: Greece’s Top Christian Tour Operator Launches New Site for US Agencies & Churches

Google (GOOGL); Unveils Android CLI 1.0 as AI Agents Get Deeper Dev Access