

Bitcoin Falls Below 2 Year MA as Traders Eye Fresh Accumulation Zone
Bitcoin trades near $75K after falling below its 2 year MA as traders watch $72K support and accumulation signals.
Bitcoin traded near $75,318 on the daily Bitstamp chart after falling below its reported two year moving average near $86,000.
Traders tracking the 2 Year MA Multiplier now view this level as a key marker for possible accumulation. The indicator is also used to compare long term Bitcoin cycle phases.
Bitcoin Falls Below the 2 Year MA
Bitcoin is now trading below the green line of the 2 Year MA Multiplier. Market analysts describe this area as a possible buy zone.
The indicator compares Bitcoin’s price with its two year moving average. It also uses a higher red line as a possible sell zone.
According to the shared market view, Bitcoin’s current price is near $77,000. The two year moving average is placed near $86,000.
The same model places the upper red line near $430,000. Traders using this tool often compare current action with earlier cycles.
The claim states that similar signals appeared in 2015, 2019, and 2023. However, past signals do not guarantee future price action.
The phrase “buy zone” reflects a market framework, not a confirmed outcome. Bitcoin remains volatile, and risk controls remain central.
Traders Watch Fresh Accumulation Zone
The current setup has raised interest in a possible Bitcoin accumulation zone. Some traders see the drop below $86,000 as a long term signal.
The shared strategy favors dollar cost averaging instead of one large purchase. This method spreads entries across time and price levels.
Bitcoin is also trading near a key support range on the daily chart. Price is consolidating around $72,000 to $75,000.
A deeper support area is seen between $60,000 and $65,000. That zone acted as demand during the recent sharp selloff.
The chart shows that Bitcoin remains below the $80,000 area. Buyers have not yet confirmed a strong recovery above that level.
A daily close above $80,000 could improve short term sentiment. A move above $88,000 to $92,000 would carry more weight.
Read Also:
Momentum Indicators Remain Weak
The daily chart shows Bitcoin below several rising Fibonacci fan lines. This suggests the broader uptrend has lost strength.
The nearest resistance appears near $78,000 to $82,000. Sellers may continue to defend that area in the short term.
The MACD remains below the zero line, with a negative histogram. This shows that bearish momentum is still present.B
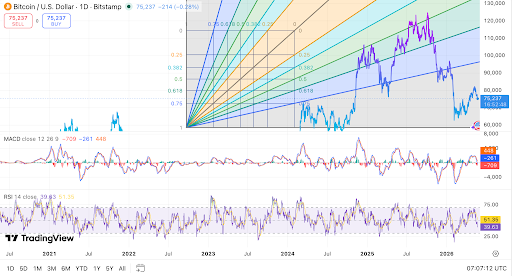 Bitcoin trades near $75K as momentum indicators remain under pressure. Source TradingView.
The RSI is near 40, which points to weak market strength. It is not yet in a deep oversold range.
Bitcoin bulls need to protect the $72,000 area. A break below that level could place focus on $60,000 to $65,000.
The market view remains mixed while Bitcoin trades under the two year moving average. Traders are watching whether support can hold.
For now, the 2 Year MA Multiplier has become a key topic again. The signal has renewed debate over Bitcoin’s long term accumulation phase.
The post Bitcoin Falls Below 2 Year MA as Traders Eye Fresh Accumulation Zone appeared first on Live Bitcoin News.


Ayrıca Şunları da Beğenebilirsiniz

Super Micro Computer (SMCI) Co-Founder Enters Not Guilty Plea in AI Chip Export Case

Crypto Market Review: 3 Undervalued Altcoins Investors Are Watching

Waymo robotaxi flood recall triggers wider service pause


Popüler Haberler
Daha fazla
