

Figma Stock Rose 9% This Week: Where FIG Could Go in 2026
Key Stats for Figma Stock
- Current Price: $21.34
- Target Price (Mid): ~$68
- Street Target: ~$35
- Potential Total Return: ~217%
- Annualized IRR: ~29% / year
- Earnings Reaction: +13.24% (5/14/26)
- Max Drawdown: 86.20% (6/25/26)
Now Live: Discover how much upside your favorite stocks could have using TIKR’s new Valuation Model (It’s free) >>>
The Bounce Nobody Should Confuse for a Verdict
Figma, Inc. (FIG) closed at $21.34 on July 2, up 9.49% on the day and riding a second straight leg higher off the June lows. Just a week earlier, on June 25, the stock hit a drawdown of 86.20%, its worst since going public. So a near double-digit pop should feel like relief. The problem is what drove it.
This move did not come from the business. It came from the plumbing of the market. Figma was added to several major Russell indexes in the June reconstitution, and the passive-fund buying that follows an index add is mechanical, not a judgment on fundamentals. On top of that, Citigroup’s Buy rating and roughly $35 target kept a fresh bullish voice in front of traders. That is the whole tension in one sentence. The buyers this week were rules-based funds and momentum traders, not investors newly convinced that the story works.
So the question the market still cannot answer is the one that matters. Strip out the index flows, and is Figma a broken company or a mispriced one?
Why the Rally Was Mechanical, Not Fundamental
Start with the index event, because it explains the timing. Figma joined the Russell 1000, 2500, and 3000 and related benchmarks when the reconstitution took effect after the June 26 close. FTSE Russell moved to a semi-annual schedule this year, and roughly $11 trillion is benchmarked to these indexes, so inclusion forces passive funds to buy a set amount of stock regardless of price. That buying lands in the days around the rebalance. It is real demand, but it says nothing about whether the company is worth owning.
The irony is that the same event cut both ways. FIG actually fell 9.8% on June 25 to close at $16.84, near its 52-week low, as traders braced for the rebalance. Then it reversed hard into July. That round trip is what a stock looks like when flows, not fundamentals, are steering the tape.
Citi gave the bounce a narrative to hang on. Analyst Tyler Radke initiated coverage with a Buy and a target in the mid-$30s, framing Figma as built for AI-driven design work. A target that far above a high-teens stock gives momentum traders a number to point at. What it does not do is resolve the bear case, which lives one layer deeper than any price target.
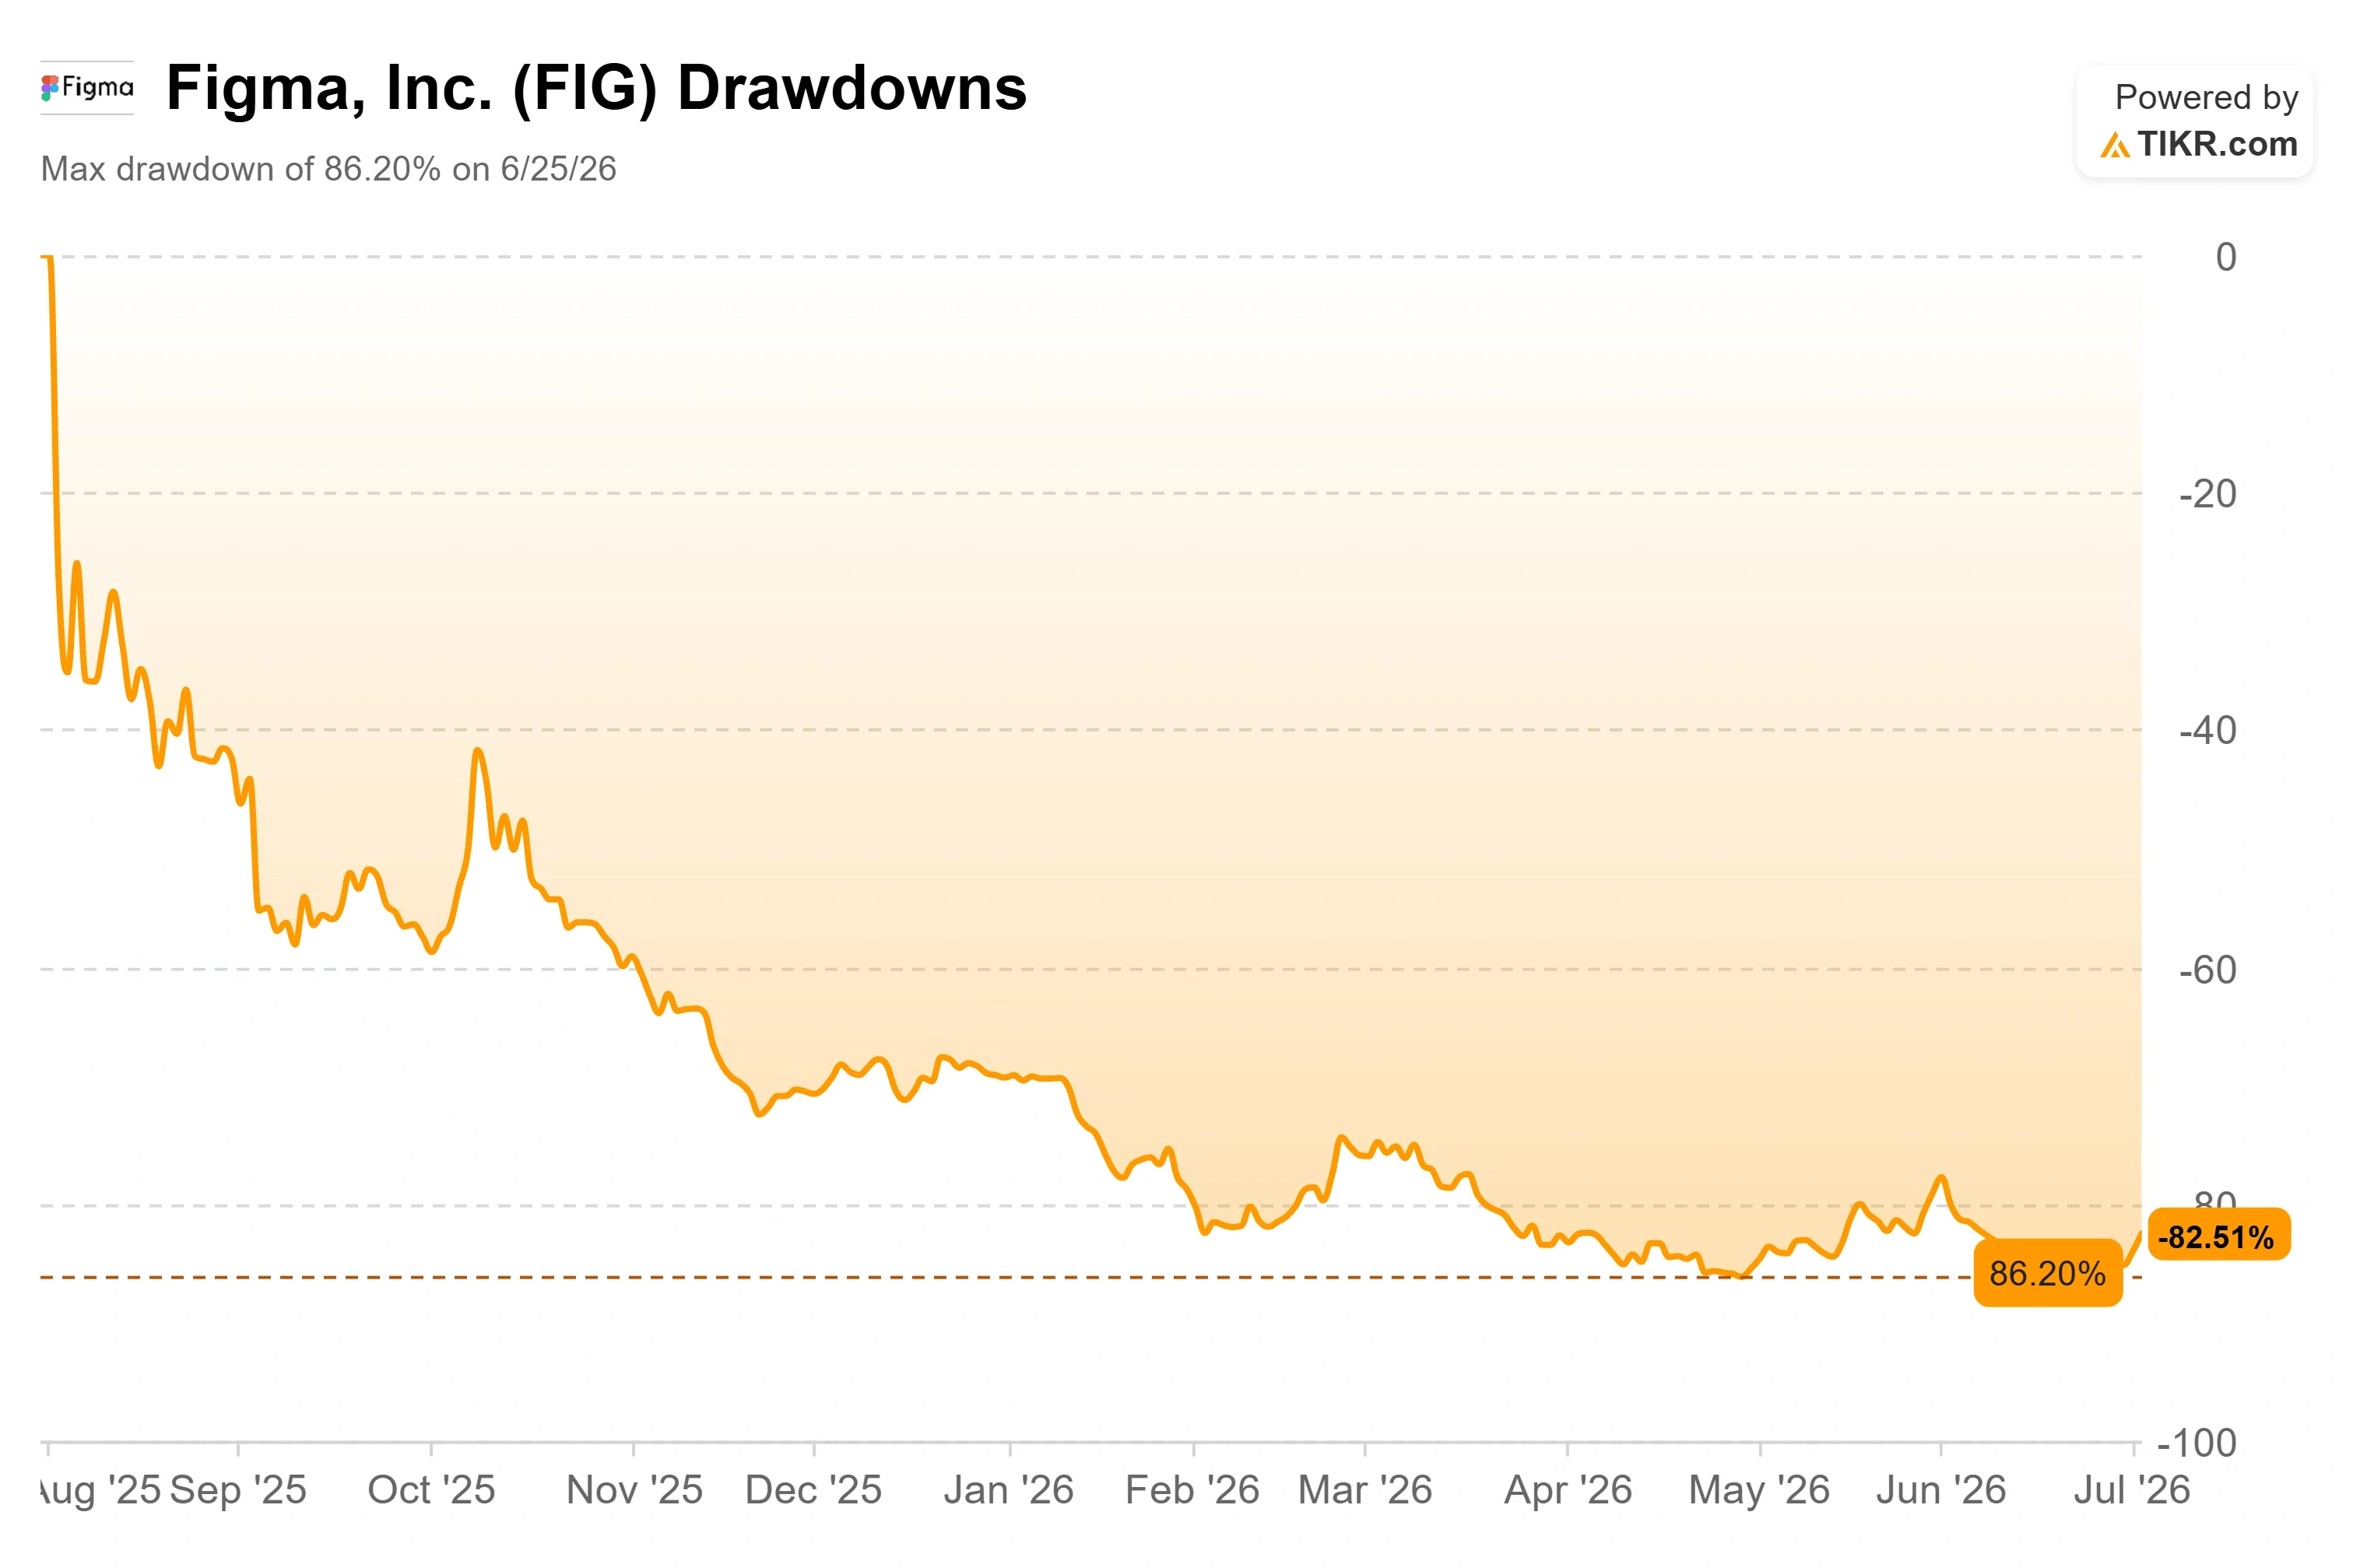 Figma Drawdowns (TIKR)
See historical and forward estimates for Figma stock (It’s free!) >>>
The Business Is Doing the Opposite of What the Chart Suggests
Here is where the bulls have their footing. Figma’s first quarter was its strongest as a public company. Revenue grew 46% year-over-year to $333 million, accelerating from 40% the prior quarter. Net dollar retention, which measures how much more existing customers spend over time, reached 139%, the highest in over two years. Paid customers grew 54% year-over-year to roughly 690,000.
The number that matters most for the AI debate is willingness to pay. Figma began enforcing AI credit limits on March 18, and management gave a hard data point on how that landed. CFO Praveer Melwani said on the Q1 2026 earnings call that as of late April, more than 75% of Org and Enterprise users who had previously blown past their limits kept consuming credits under the new paid system, and over 95% stayed active on the platform. As he put it, AI usage and adoption “now translates into revenue.” That matters because it converts engagement into dollars for the first time, which is exactly the bridge the bears say does not exist.
CEO Dylan Field addressed the elephant in the room without dodging it. Asked about foundation-model rivals building design tools, he named Anthropic directly: “I think when it comes to Anthropic, obviously, we can’t dismiss them.” He then argued that Figma’s performant multiplayer canvas, meaning the real-time shared workspace where many people edit at once, and its deep product context are the parts rivals cannot easily copy. His candor is the point. The entire bear case rests on whether management sees the threat clearly, and on the May 14 print, the market liked what it heard, sending FIG up 13.24% that day, its strongest earnings reaction as a public company.
What the Valuation Says Once the Flows Fade
Now quantify the disconnect. Figma trades at about 6.4x NTM revenue, a multiple that has compressed from above 21x a year ago. On a peer basis, the contrast is stark. Adobe trades at roughly 3.2x NTM revenue, and Manycore Tech trades near 16.9x. Figma sits between them, yet it grew revenue by around 46% last quarter, faster than either. A grower at that pace priced at 6.4x forward sales is not the valuation of a company the market believes in. It is the valuation of one that is bracing to see disrupted.
That fear is not baseless. Google launched a free AI design tool, Stitch, earlier this year, and Anthropic’s Claude Design followed in April. If foundation-model providers commoditize design generation, Figma’s pricing power erodes, and the growth assumption breaks. There is also the governance cloud that Russell adds, which does nothing to clear. On May 28, Findell Capital Management issued a letter demanding a simpler product line, costs in line with peers, and an independent board investigation. Its sharpest point was on share dilution: analyst estimates point to roughly $375 million, about 27% of revenue, in 2026 stock-based compensation, versus about 8% at Adobe. For a company still posting GAAP losses, that is a real drag on per-share value. The bull case is that switching costs are real, retention is rising, and AI is a tailwind. The bear case is that the most dangerous competitor sat on Figma’s board until April, and a bigger lock-up is still coming in August.
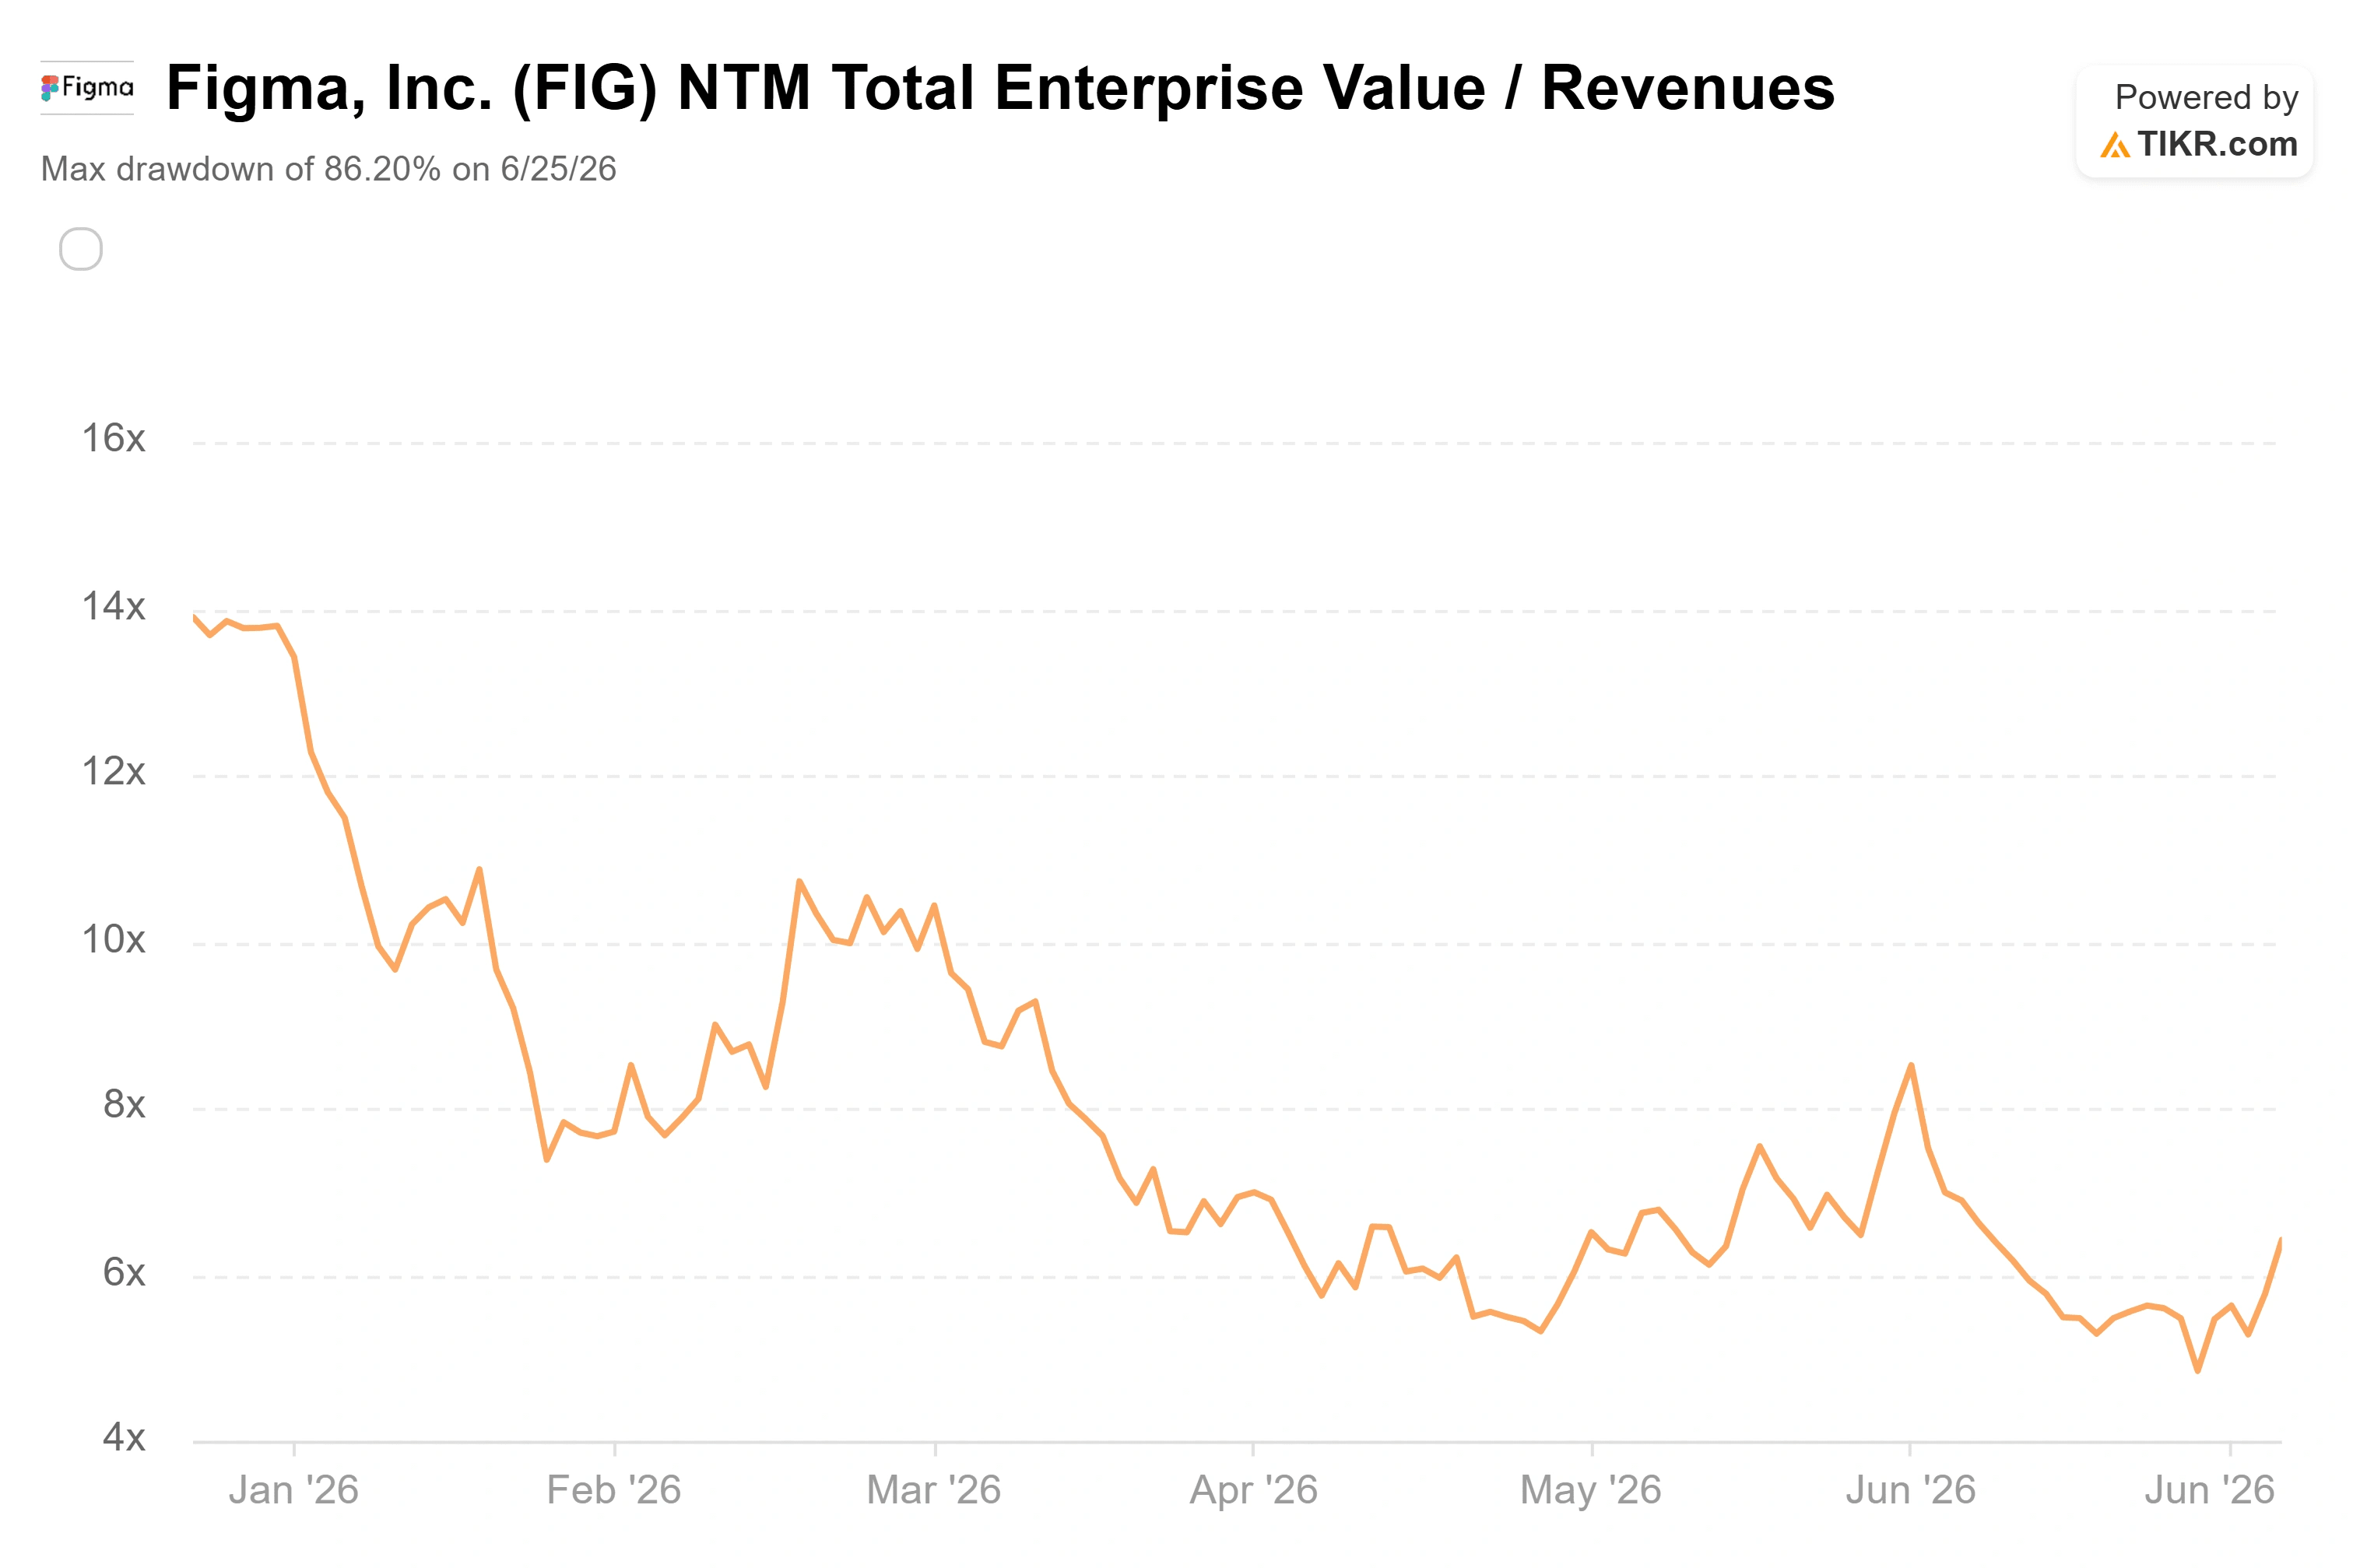 Figma NTM EV/Revenues (TIKR)
See how Figma performs against its peers in TIKR (It’s free!) >>>
TIKR Advanced Model Analysis
- Current Price: $21.34
- Target Price (Mid): ~$68
- Potential Total Return: ~217%
- Annualized IRR: ~29% / year
 Figma Advanced Valuation Model (TIKR)
See analysts’ growth forecasts and price targets for Figma stock (It’s free!) >>>
Using TIKR’s mid-case scenario, the model puts a target of around $68 on Figma stock, realized at the end of 2030. That implies roughly 217% total upside and about a 29% annualized return over the next four and a half years. The mid case is the right lens because it assumes disciplined execution rather than a best-case sprint.
Two revenue drivers carry the forecast: continued seat expansion across enterprise organizations, and AI credit monetization now that paid limits are live and converting. The margin driver is operating leverage, because Figma’s roughly 80% gross margin lets revenue growth flow toward profitability while management leans on model routing and first-party models to hold down inference costs. The primary risk is AI commoditization: if rivals like Claude Design erode pricing power, the mid-case revenue CAGR of around 19% does not hold.
The upside: if AI converts from threat to tailwind and seat growth compounds, the model’s around $68 target reflects a durable platform the market mispriced in a panic.
The downside: if growth decelerates toward 30% and losses persist, a slide back toward the Street’s roughly $35 target, or lower, is the more honest outcome.
Conclusion
Index flows are a one-time event. They pushed FIG higher this week, and they will fade. What comes next is a real test with a date on it.
The first is the August lock-up. A tranche estimated at over $6 billion in low-cost-basis shares is expected to unlock, and that supply overhang can swamp any index bid. Watch whether the stock holds above the low $20s through it. The second is the board’s response to Findell. If Figma announces a governance review or explicit cost targets before that unlock, the re-rating can start on its own. The third is the September quarter’s net dollar retention. Above 135% with continued credit consumption confirms AI is a tailwind. A drop toward the high 120s, paired with revenue growth slipping below the high 30s, hands the bears their proof. Come back for the next earnings report on September 9. That is when the fundamentals, not the flows, get their turn to speak.
See what stocks billionaire investors are buying so you can follow the smart money with TIKR.
Should You Invest in Figma?
The only way to really know is to look at the numbers yourself. TIKR gives you free access to the same institutional-quality financial data that professional analysts use to answer exactly that question.
Pull up Figma, and you’ll see years of historical financials, what Wall Street analysts expect for revenue and earnings in the quarters ahead, how valuation multiples have moved over time, and whether price targets are trending up or down.
You can build a free watchlist to track Figma alongside every other stock on your radar. No credit card required. Just the data you need to decide for yourself.
Analyze Figma on TIKR Free →
Looking for New Opportunities?
- See what stocks billionaire investors are buying so you can follow the smart money.
- Analyze stocks in as little as 5 minutes with TIKR’s all-in-one, easy-to-use platform.
- The more rocks you overturn… the more opportunities you’ll uncover. Search 100K+ global stocks, global top investor holdings, and more with TIKR.
Disclaimer:
Please note that the articles on TIKR are not intended to serve as investment or financial advice from TIKR or our content team, nor are they recommendations to buy or sell any stocks. We create our content based on TIKR Terminal’s investment data and analysts’ estimates. Our analysis might not include recent company news or important updates. TIKR has no position in any stocks mentioned. Thank you for reading, and happy investing!


Ayrıca Şunları da Beğenebilirsiniz

Drift Protocol Breach Triggers Up to $285 Million Losses

Iran’s foreign minister targeted in assassination attempt, wife killed

AI predicts XRP price for April 30, 2026


Popüler Haberler
Daha fazla
