

Solana (SOL) Back On The Defensive—Can Bulls Prevent Another Drop?
Solana failed to stay above $67 and corrected some gains. SOL price is moving lower and might aim for another increase if it stays above $63.00.
- SOL price started a downside correction below $66 against the US Dollar.
- The price is now trading below $65 and the 100-hourly simple moving average.
- There was a break below a bullish trend line with support at $66 on the hourly chart of the SOL/USD pair (data source from Kraken).
- The pair could extend losses if it dips below the $63 zone.
Solana Price Dips Again
Solana price failed to stay above $67 and started a downside correction, like Bitcoin and Ethereum. SOL dipped below $66 and $65 to enter a short-term bearish zone.
There was a move below the 50% Fib retracement level of the upward wave from the $60.12 swing low to the $67.90 high. There was a break below a bullish trend line with support at $66 on the hourly chart of the SOL/USD pair. The price even tested the $63.20 support.
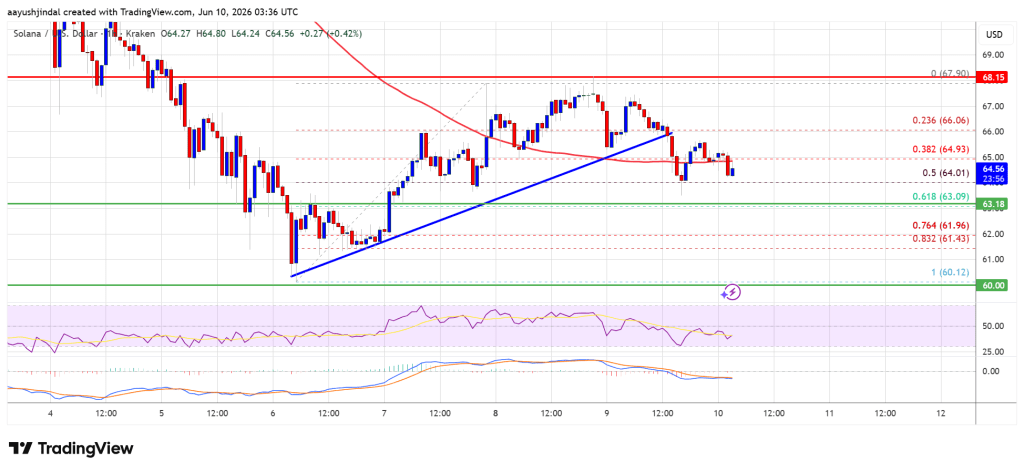
Solana is now trading below $65 and the 100-hourly simple moving average. On the upside, the price is facing resistance near the $65 level. The next major resistance is near the $66 level. The main resistance could be $67.20. A successful close above the $67.20 resistance zone could set the pace for another steady increase. The next key resistance is $68. Any more gains might send the price toward the $70 level.
Downside Break In SOL?
If SOL fails to rise above the $66 resistance, it could start another decline. Initial support on the downside is near the $63.10 zone and the 61.8% Fib retracement level of the upward wave from the $60.12 swing low to the $67.90 high. The first major support is near the $62.20 level.
A break below the $62.20 level might send the price toward the $60 support zone. If there is a close below the $60 support, the price could decline toward the $55 support in the near term.
Technical Indicators
Hourly MACD – The MACD for SOL/USD is gaining pace in the bearish zone.
Hourly Hours RSI (Relative Strength Index) – The RSI for SOL/USD is below the 50 level.
Major Support Levels – $63.10 and $62.50.
Major Resistance Levels – $65.00 and $67.20.


You May Also Like

Robotics Automation Prototyping: Engineering Kinetic Agility into End-Effectors

Why Businesses Need Professional Machine Design and Development Services

Lenovo Stock Drops 10% As Price Hike Reports Hit — Is the 140% Rally at Risk?


