

How to Use the Bull and Bear Index (BBI) in U.S. Stock Trading: A Complete Beginner's Guide
Key Takeaways
- The Bull and Bear Index (BBI) is a trend-following indicator that combines moving averages of closing prices over different periods. It serves as a reference line for identifying bullish and bearish market conditions.
- BBI typically combines four moving averages: the 3-day, 6-day, 12-day, and 24-day averages. It is calculated by adding them together and dividing the sum by 4.
- A stock price above the BBI line is generally considered bullish, while a price below it is generally considered bearish.
- A closing price that crosses above the BBI line may signal a buying opportunity, while a closing price that crosses below it may signal a selling opportunity.
1. What Is the Bull and Bear Index (BBI)?
The Bull and Bear Index (BBI) is an indicator that averages moving averages of closing prices over different periods. It typically combines four moving averages: the 3-day, 6-day, 12-day, and 24-day averages. The idea behind BBI is that a single moving average can be sensitive to market noise. Combining short- and medium-term average prices provides a smoother view of the balance between buying and selling pressure.
2. How BBI Is Calculated
BBI is calculated as follows:
BBI = (3-day moving average + 6-day moving average + 12-day moving average + 24-day moving average) / 4
The 3-day and 6-day averages reflect short-term trends, while the 12-day and 24-day averages reflect medium-term trends. By averaging all four, BBI combines the responsiveness of short-term moving averages with the stability of medium-term moving averages, helping reduce the frequent false signals that a single moving average may generate.
3. How to Use BBI in U.S. Stock Trading
3.1 Identify bullish and bearish market conditions
The most basic use of BBI is to distinguish between bullish and bearish market conditions:
- Stock price above the BBI line: This is generally considered bullish, with buying pressure dominating. Investors may consider holding their positions in anticipation of further gains or looking for potential buying opportunities on pullbacks.
- Stock price below the BBI line: This is generally considered bearish, with selling pressure dominating. Investors should remain cautious, manage their position sizes, and take a defensive approach.
3.2 Identify buy and sell signals
BBI can help identify trading signals that suggest a shift between bullish and bearish conditions:
- Buy signal: In a rising market, a daily closing price that crosses above the BBI line may indicate a shift from bearish to bullish conditions and a potential buying opportunity. This may suggest that selling pressure is easing and buyers are regaining control.
- Sell signal: In a falling market, a daily closing price that crosses below the BBI line may indicate a shift from bullish to bearish conditions and a potential selling opportunity. Investors may consider reducing or closing their positions to limit exposure to further declines.
Signals should be assessed using closing prices rather than intraday prices. Changes in trading volume can provide additional confirmation and help traders avoid being misled by short-lived false breakouts.
3.3 Consider the broader trend
BBI is a lagging, trend-following indicator. It is calculated from historical prices and reflects market changes that have already occurred. It therefore tends to work best in markets with a clear trend. In sideways or range-bound markets with no clear direction, closing prices may repeatedly cross the BBI line, generating more false signals. Beginners are advised to use the indicator primarily when the market has a clear trend.
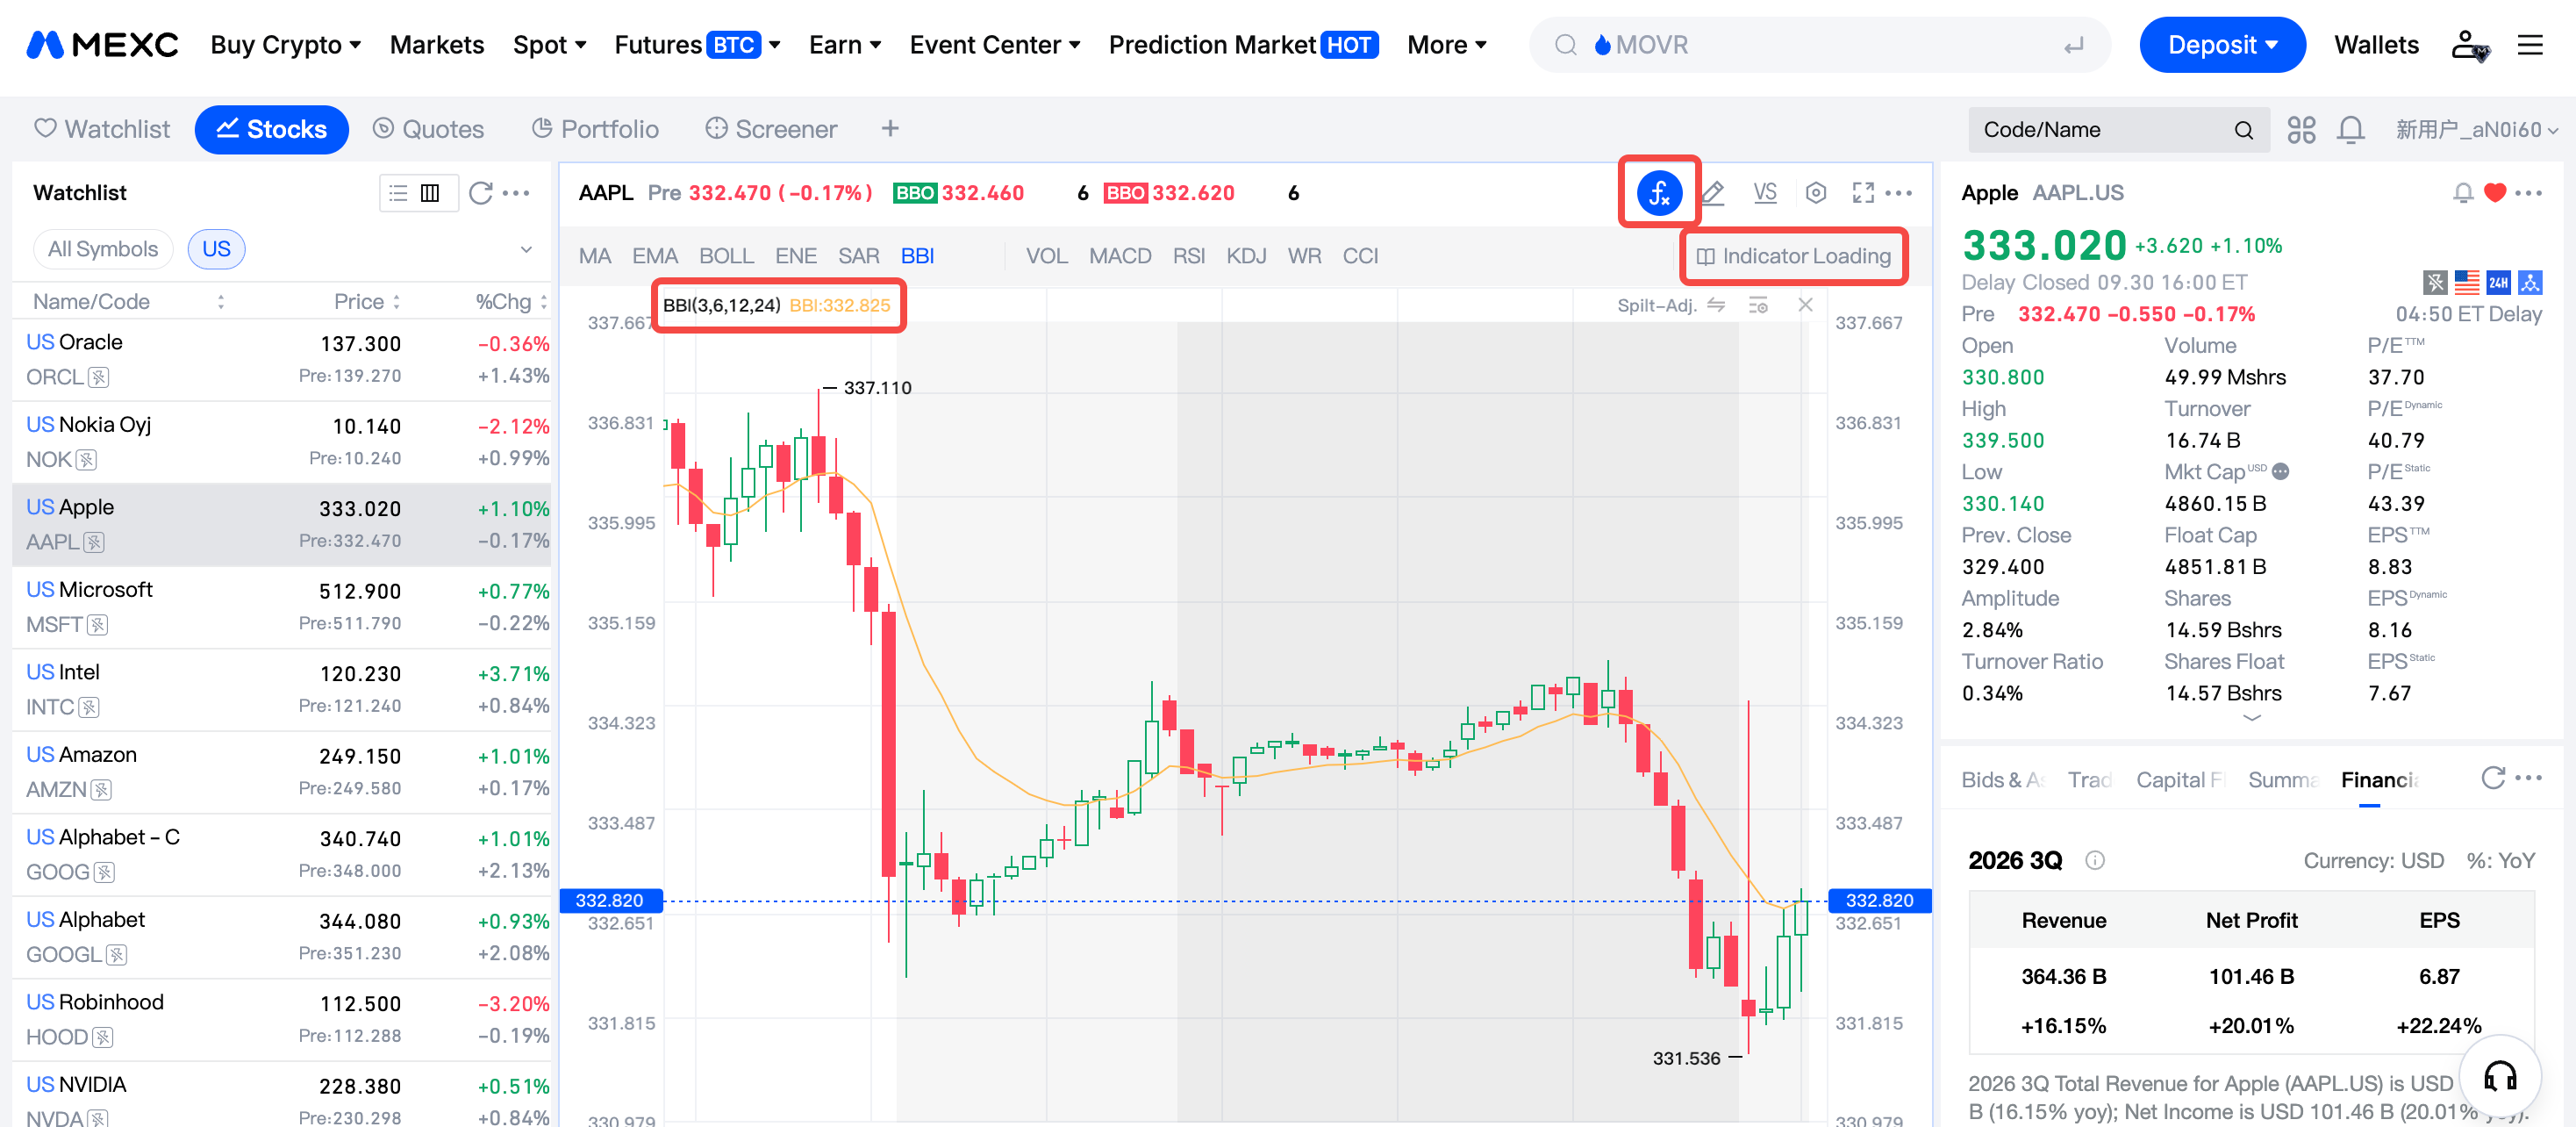
On the MEXC RealStocks page, click Indicator Loading, then select and add BBI to display it on the candlestick chart.
4. Advantages and Limitations of BBI
Advantages: BBI uses a simple, transparent calculation and provides straightforward buy and sell signals, making it accessible to beginners. By combining average prices over four periods, it produces a smoother line than a single moving average. It can also be used across different markets, including stocks, indices, and cryptocurrencies.
Limitations: As a lagging indicator, BBI cannot predict future price movements. Its signals become less reliable in range-bound markets, where it may frequently generate false signals. Technical indicators also do not account for fundamental factors such as earnings reports or macroeconomic policy. BBI is best used alongside support and resistance levels, volume analysis, and fundamental research. Always set stop-loss orders and manage risk carefully.
5. BBI FAQ
5.1 What is the formula for BBI?
BBI averages moving averages of closing prices over different periods, typically using the 3-day, 6-day, 12-day, and 24-day averages. The formula is: BBI = (3-day moving average + 6-day moving average + 12-day moving average + 24-day moving average) ÷ 4.
5.2 How do I use BBI?
A stock price above the BBI line is generally considered bullish, while a price below it is generally considered bearish. In a rising market, a daily closing price that crosses above the BBI line may indicate a shift from bearish to bullish conditions and a potential buy signal. In a falling market, a daily closing price that crosses below the BBI line may indicate a shift from bullish to bearish conditions and a potential sell signal.
5.3 What market conditions are best suited to BBI?
Trend-following indicators such as BBI tend to work best in markets with a clear direction. In sideways or range-bound markets, closing prices may repeatedly cross the BBI line, generating frequent false signals. In these conditions, traders should rely less on BBI or use other tools to filter its signals.
5.4 Can BBI be used in cryptocurrency trading?
Yes. BBI's analytical approach can be applied across different markets, including stocks, indices, and cryptocurrencies.