

How to Use the MIKE Indicator in U.S. Stock Trading: A Complete Beginner's Guide
Key Takeaways:
- MIKE is a channel-based technical analysis tool for assessing potential support and resistance in medium- to long-term stock price trends.
- The indicator plots six lines representing three levels of support and resistance: weak, medium, and strong.
- MIKE uses a reference price as the basis for its calculations and automatically adjusts its support and resistance references as stock prices fluctuate.
- Its core approach is to focus on resistance during advances and support during declines, providing a reference for swing trading.
- You can add and configure MIKE directly on MEXC's U.S. stock charts to help inform trading decisions.
1. What Is the MIKE Indicator?
MIKE is a technical analysis tool that calculates support and resistance references that change with stock price fluctuations. It plots three levels of potential support and resistance, known as weak, medium, and strong, directly on the price chart. These lines help traders assess medium- to long-term price trends.
Unlike common moving average indicators, MIKE does not rely solely on closing prices. Unlike indicators based primarily on closing prices, MIKE incorporates high and low prices into its calculations, providing additional information about the stock's trading range.
2. The Structure of the MIKE Indicator
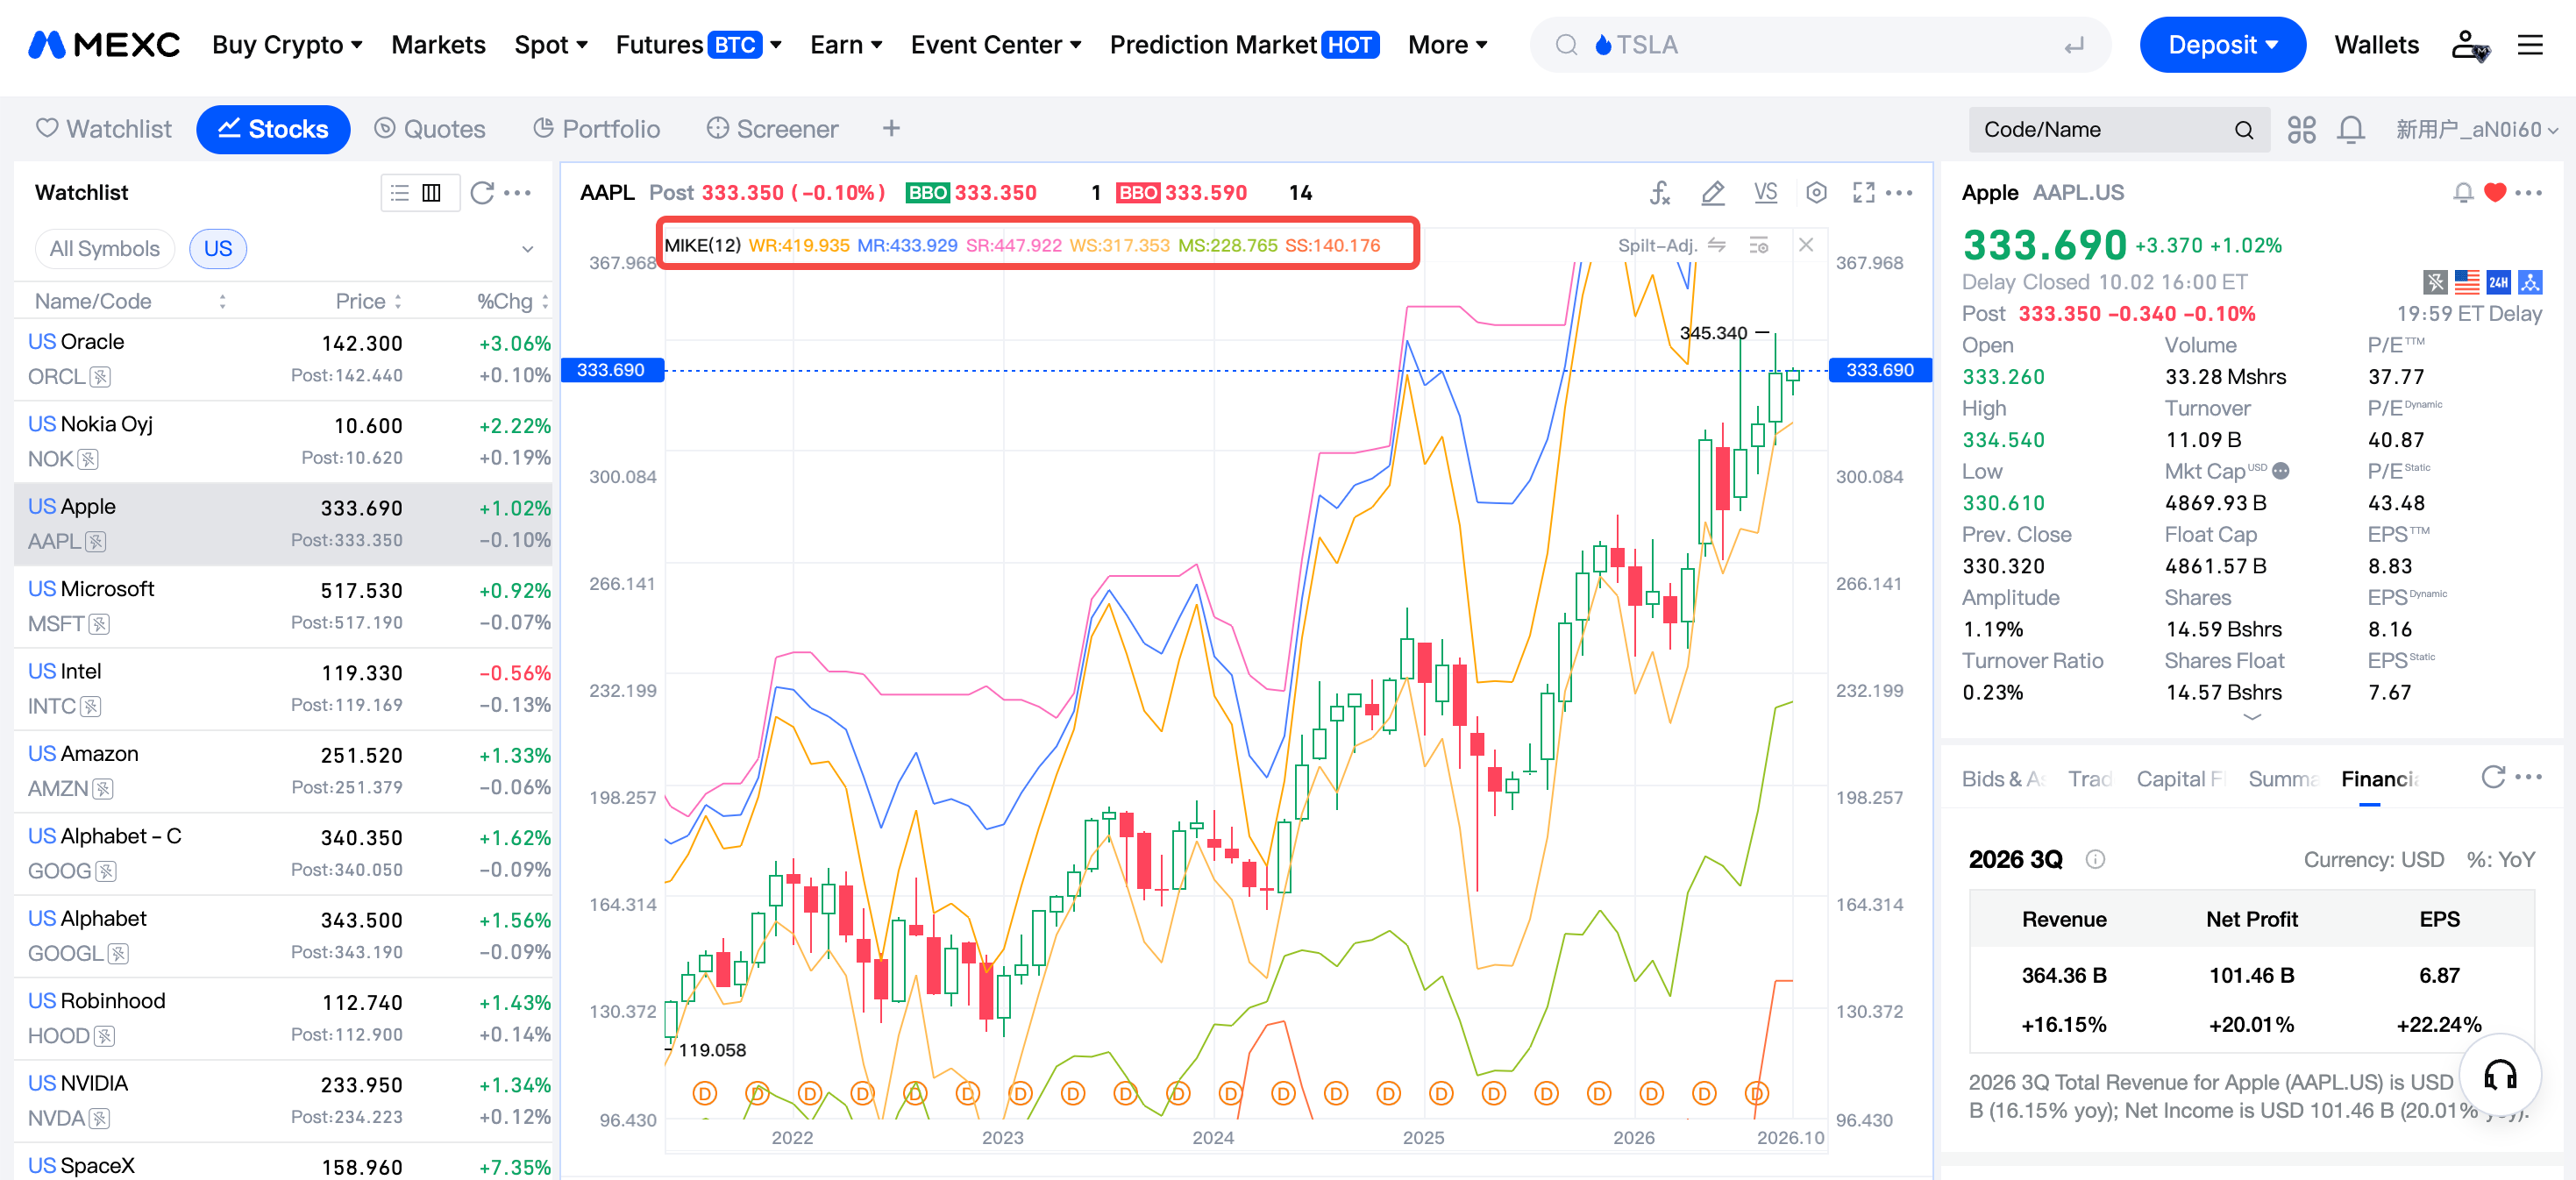
MIKE plots six lines on the chart: three upper resistance lines and three lower support lines. They form three tiers of channels. The weak resistance and support lines form a narrow channel, the medium resistance and support lines form an intermediate channel, and the strong resistance and support lines form a relatively wide channel.
This channel structure provides a visual reference for potential resistance and support. The levels update as new price data becomes available, providing changing references for potential support and resistance. This can help traders assess swing-trading opportunities.
3. How to Use MIKE in U.S. Stock Trading
Using resistance levels during advances. When a stock moves out of consolidation and into an uptrend, the three upper lines become the main references for potential resistance, while the lower support lines are less relevant to assessing immediate upside. A break above the weak resistance line may suggest further short-term gains, prompting traders to consider holding their position. A break above the medium resistance line may suggest that the uptrend could continue. When price reaches the strong resistance line after a substantial advance, traders should watch for a potential pullback or trend reversal.
Usingsupport levels during declines. When a stock moves into a downtrend, the three lower lines become the main references for potential support, while the upper resistance lines are less relevant to assessing immediate downside. A break below the weak support line may indicate short-term weakness. A break below the medium support line may suggest that the decline could continue. As price approaches the strong support line after a substantial decline, a short-term rebound may become possible.
Using therange during consolidation. When a stock trades sideways, both the upper and lower lines can provide useful references. The area between the weak and medium resistance lines may be considered a potential selling zone, while the area between the weak and medium support lines may be considered a potential buying zone. These areas can serve as references for swing-trading entries and exits.
4. How to Add MIKE to U.S. Stock Charts on MEXC
You can add and configure MIKE in MEXC's U.S. stock trading charts. Follow these steps:
1) Log in to your account, go to the U.S. stock trading page, and open the price chart for your chosen stock.
2) Click the indicator icon above the chart, then search for and select "MIKE" in the indicator list.
3) Once the indicator is added, adjust the period setting to suit your trading style. The chart will automatically display six support and resistance reference lines. Beginners can start with the default setting on a daily chart and make adjustments after becoming familiar with how the indicator behaves.
5. Important Considerations When Using MIKE
The support and resistance levels indicated by MIKE are reference levels only. They may differ from the actual highs or lows reached by the stock price.
During a sustained uptrend or downtrend, the channel can expand rapidly upward or downward, reducing its usefulness for short-term analysis. Consider MIKE alongside trading volume, chart patterns, trendlines, and other analytical tools before making trading decisions, and always maintain appropriate risk management.
6. MIKE Indicator FAQ
6.1 What is the MIKE support and resistance indicator?
The MIKE support and resistance indicator, usually called MIKE, is a technical tool that adjusts to stock price fluctuations. Its six lines provide three tiers of potential support and resistance references, known as weak, medium, and strong, to help traders assess medium- to long-term price trends.
6.2 What do support and resistance mean in trading?
Support is a price area where buying interest may help a falling stock stabilize. Resistance is a price area where selling pressure may slow or halt an advance. Both are core concepts in technical analysis.
6.3 Is MIKE an automatic support and resistance indicator?
Yes. MIKE automatically calculates and adjusts its support and resistance reference levels as stock prices fluctuate. It does not require traders to draw these lines manually.
6.4 Can you give an example of how to use support and resistance?
Suppose a U.S. stock is consolidating and then breaks above MIKE's weak resistance line on increased trading volume. This may indicate an emerging short-term upward move, and traders may consider looking for an entry on a pullback. If the price instead falls below the weak support line, it may indicate short-term weakness, making position sizing particularly important.
6.5 How can you use support and resistance with breakouts and retests?
After a confirmed breakout above resistance, the former resistance area may become a new support reference. If price retests that area, stabilizes, and resumes rising, it may signal trend continuation and provide a potential entry reference. If it does not hold, traders should be alert to a breakout driven by market noise rather than a sustained move.