Buy Crypto
Markets
Spot
FuturesBTC
Earn
Event Center
Rewards Hub
More
How to Use the Momentum Indicator (MTM) in Trading: A Complete Beginner's GuideHow to Use the Momentum Indicator (MTM) in Trading: A Complete Beginner's Guide
Category List
Cancel

How to Use the Momentum Indicator (MTM) in Trading: A Complete Beginner's Guide

Key Takeaways:

  • The Momentum Indicator measures the speed and strength of price movements rather than the price level itself.
  • Zero line crossovers, divergence signals, and overbought and oversold conditions are the three primary ways to interpret momentum.
  • Common momentum indicators include the Relative Strength Index, Moving Average Convergence Divergence, Rate of Change, and Stochastic Oscillator.
  • Users can easily add the Momentum Indicator to the candlestick chart on MEXC and customize its parameters to support their trading decisions.

1. What Is the Momentum Indicator?


The Momentum Indicator, or MTM, is one of the most widely used tools in technical analysis. It measures how quickly an asset's price changes over a specific period.

The principle behind momentum is similar to inertia in physics. Once a price trend is in motion, it often continues in the same direction until a significant market force causes it to slow down or reverse.

Unlike analysis methods that focus primarily on price levels, the Momentum Indicator shows whether a price movement is accelerating or losing speed. Strong momentum may support the continuation of a trend, while weakening momentum may indicate that a pullback or reversal is approaching.

The indicator can therefore help traders assess whether a trend remains strong enough to follow and identify when it may be approaching its final stage.
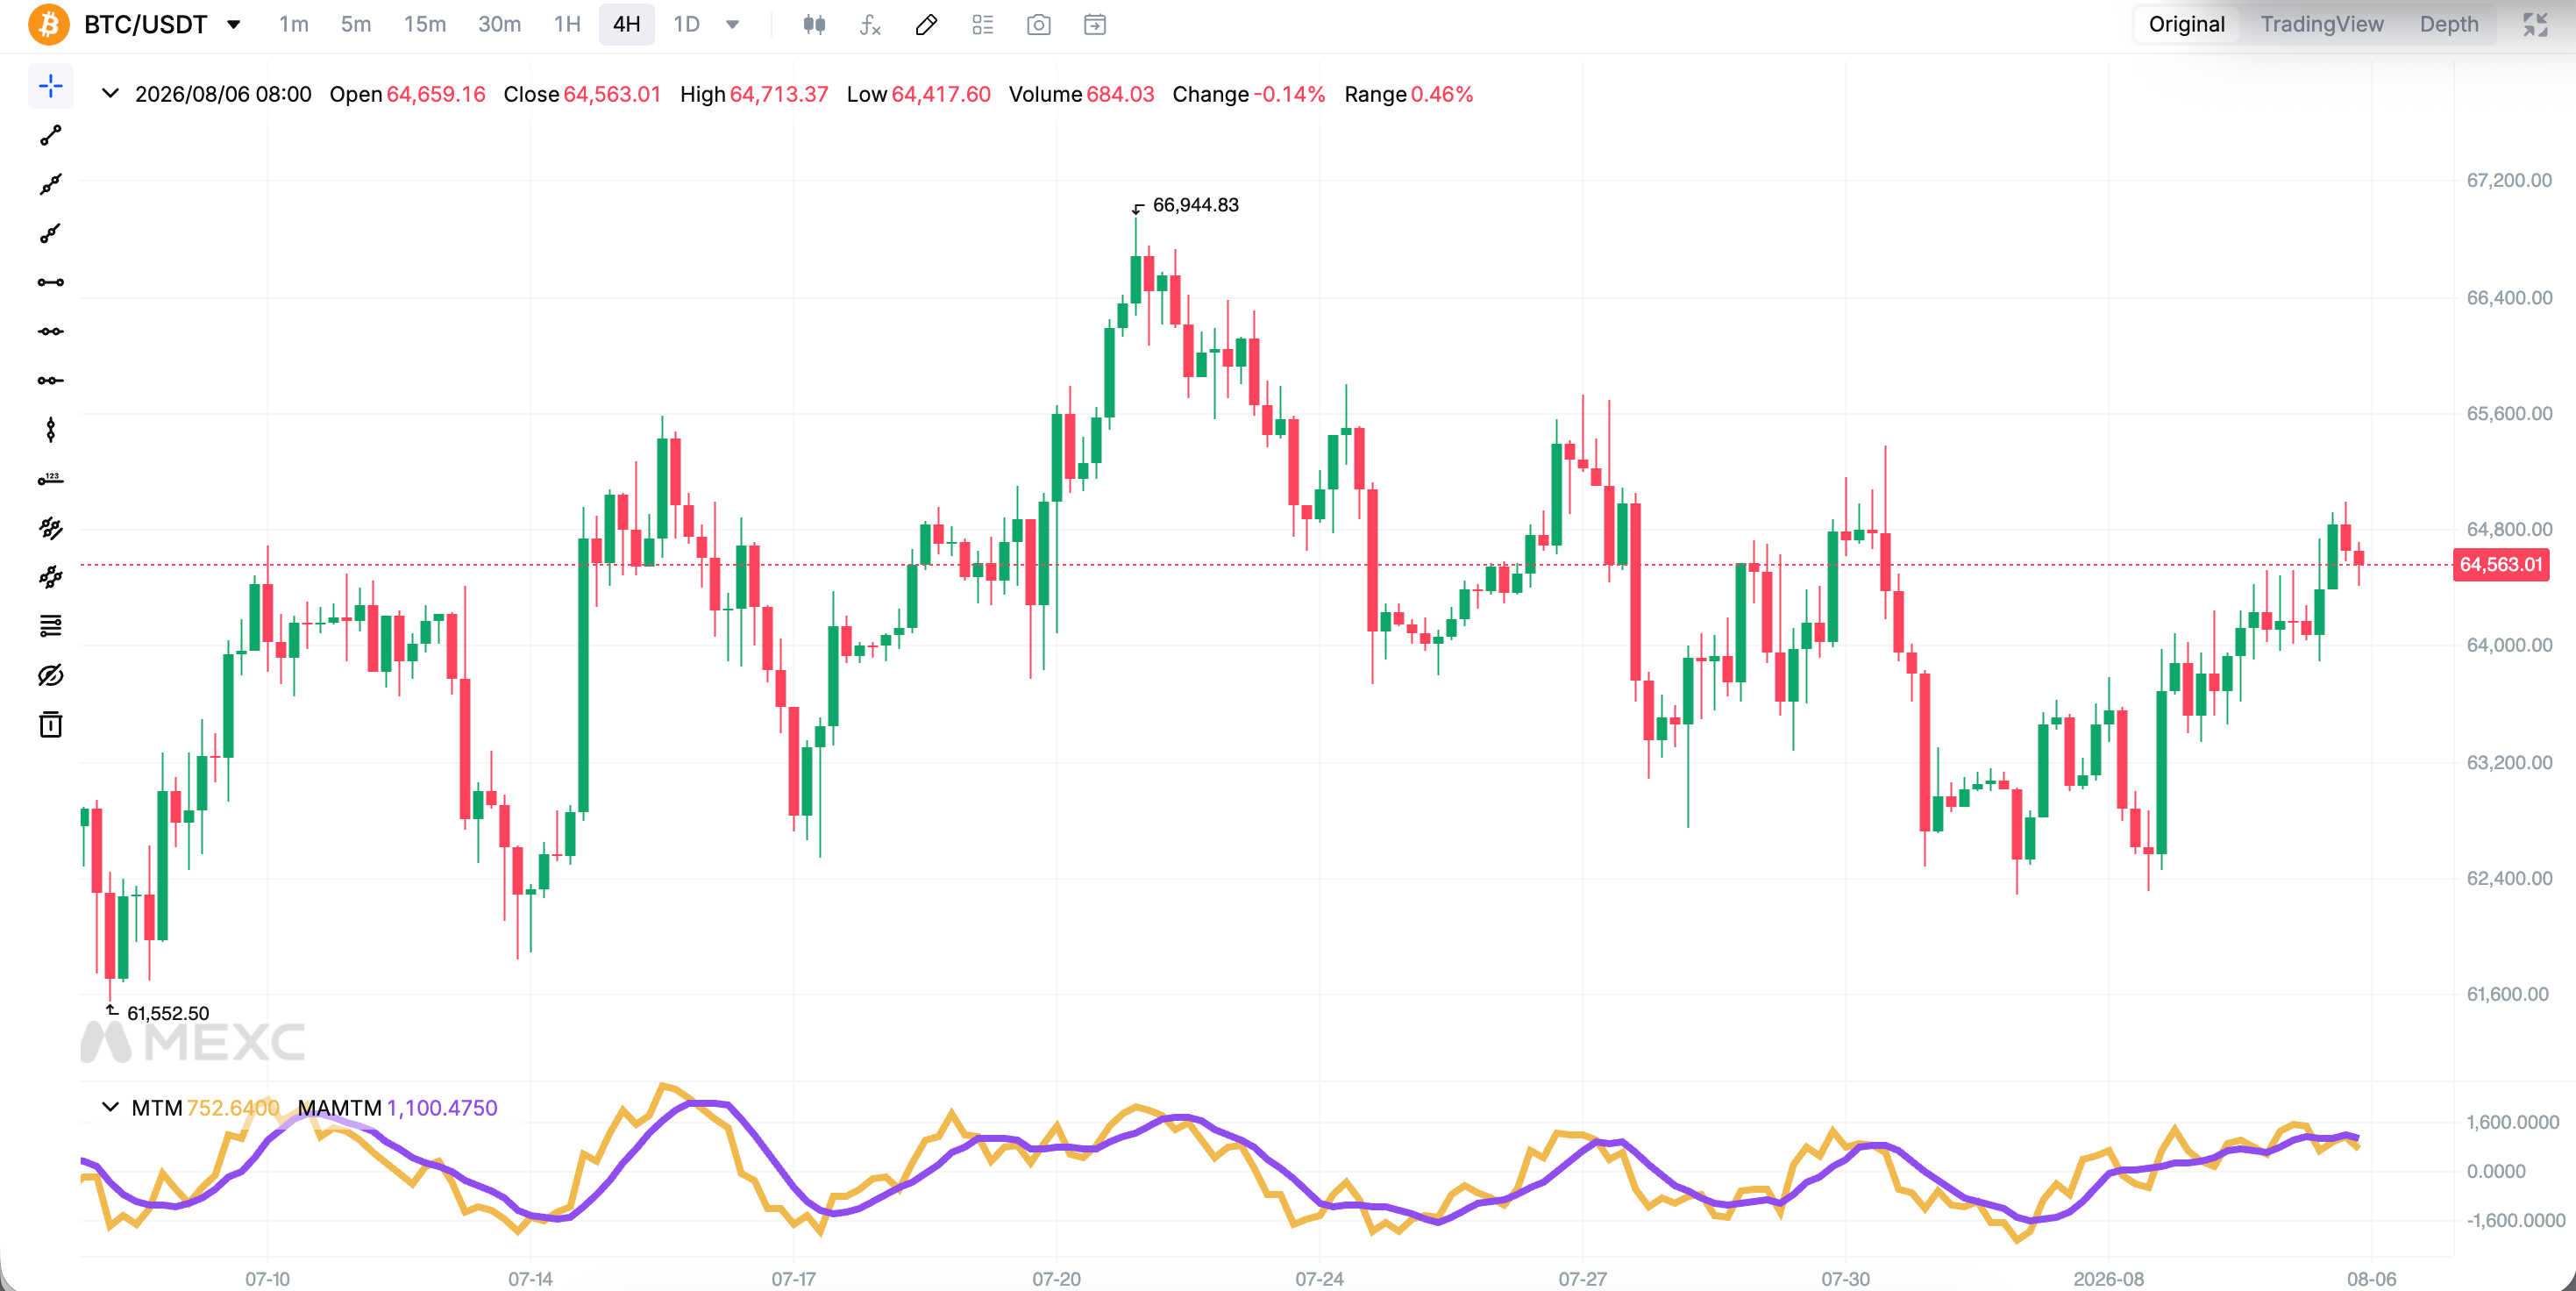

2. How to Use the Momentum Indicator: Three Core Methods


2.1 Zero Line Crossover Signals


When the momentum line crosses above the zero line, it indicates that upward momentum is increasing. In an established uptrend, traders may use this as a bullish reference signal.

When the momentum line crosses below the zero line, it suggests that downward momentum is strengthening. In an established downtrend, traders may interpret this as a bearish reference signal.

Crossover signals that align with the broader market trend are generally more reliable than signals that move against it.

2.2 Divergence Signals


Divergence is one of the most valuable signals provided by the Momentum Indicator.

Bearish divergence: The price reaches a new high, but the Momentum Indicator fails to reach a corresponding new high. This suggests that upward momentum is weakening and that the price may pull back.

Bullish divergence: The price reaches a new low while the Momentum Indicator begins to rise. This indicates that selling pressure may be weakening and that the price could rebound.

Divergence does not guarantee that a reversal will occur, but it can provide an early warning that the current trend is losing strength.

2.3 Overbought and Oversold Conditions


The standard Momentum Indicator does not have fixed upper or lower boundaries. Traders must therefore identify potential overbought and oversold levels by reviewing the historical behavior of each asset.

Bounded oscillators, such as the Relative Strength Index, provide standardized reference ranges and may be easier for beginners to interpret.

3. Momentum Indicator Parameter Settings


The most commonly used default period for the Momentum Indicator is 12.

A shorter period makes the indicator more responsive to recent price movements, but it may also generate more market noise and false signals. A longer period produces a smoother indicator line but responds more slowly to changes in market conditions.

Short-term traders may consider using a shorter period to increase sensitivity. Medium-term and long-term traders may prefer a longer period to filter out short-term price fluctuations.

On MEXC, users can adjust the Momentum Indicator parameters according to their trading style and compare signals across multiple timeframes.


4. Considerations When Using the Momentum Indicator


1)Avoid relying on a single indicator. The Momentum Indicator measures the speed of price movements but cannot independently identify the broader trend or important price levels. Traders should combine it with tools such as moving averages and support and resistance levels.

2)Consider the market environment. The Momentum Indicator may produce frequent false signals in sideways or range-bound markets. Momentum signals also tend to be more reliable in rising markets than in declining markets.

3)Apply appropriate risk management. Technical indicators are analytical tools, and every signal should be supported by appropriate position sizing and stop-loss rules. When trading on MEXC, users can take advantage of the platform's take-profit and stop-loss features to manage risk.

5. Common Momentum Indicators


Momentum indicators are a broad category of technical analysis tools. In addition to the standard MTM indicator, the following indicators are also widely used:

Relative Strength Index (RSI): RSI moves between 0 and 100 and measures the speed and magnitude of price changes. It is commonly used to identify overbought conditions above 70 and oversold conditions below 30.

Moving Average Convergence Divergence (MACD): MACD uses the relationship between moving averages to reflect both trend direction and momentum. Crossovers between the MACD line and the signal line are commonly used as trading reference signals.

Stochastic Oscillator (KDJ): This indicator measures the current closing price’s relative position within a selected price range. Traders commonly use it to assess potential short-term price movements.

Rate of Change (ROC): ROC moves above and below a zero line and measures the percentage change between the current price and the price from a previous period.

6. Momentum Indicator FAQ


6.1 How should I set the Momentum Indicator parameters?


The default period is usually 12. Short-term traders may use a shorter period for greater sensitivity, while medium-term and long-term traders may use a longer period to reduce market noise.

6.2 Which momentum indicator is the most accurate?


No momentum indicator is universally the most accurate. MACD is often considered a comprehensive tool for analyzing both trends and momentum, while RSI is particularly useful for identifying overbought and oversold conditions. Performance depends on the market environment and how the indicator is applied.

6.3 What are the most common momentum indicators?


Common momentum indicators include the standard Momentum Indicator, Relative Strength Index, Moving Average Convergence Divergence, Rate of Change, and Stochastic Oscillator.

6.4 Does momentum trading really work?


Momentum strategies have historically performed well in markets with clear trends. However, they may generate unreliable signals in sideways markets. Their effectiveness depends on appropriate signal filtering, market analysis, and risk management.

6.5 Is the Momentum Indicator useful?


The Momentum Indicator is a practical tool for evaluating trend strength. However, it has limitations, including the absence of fixed boundaries and less reliable signals in range-bound markets. Traders should use it together with other analytical tools.

6.6 How do I use the Momentum Indicator on MEXC?


Open the candlestick chart on the MEXC Spot or Futures trading page. Search for the Momentum Indicator in the indicators menu, add it to the chart, and customize its parameters according to your trading strategy.


Risk Disclaimer: Technical indicators are calculated using historical data and are provided for reference only. They cannot guarantee future market performance. Digital asset markets are highly volatile, and trading involves risk. Make decisions carefully based on your own risk tolerance and avoid following market trends blindly.

How to Use the Momentum Indicator (MTM) in Trading: A Complete Beginner's Guide

Key Takeaways:

  • The Momentum Indicator measures the speed and strength of price movements rather than the price level itself.
  • Zero line crossovers, divergence signals, and overbought and oversold conditions are the three primary ways to interpret momentum.
  • Common momentum indicators include the Relative Strength Index, Moving Average Convergence Divergence, Rate of Change, and Stochastic Oscillator.
  • Users can easily add the Momentum Indicator to the candlestick chart on MEXC and customize its parameters to support their trading decisions.

1. What Is the Momentum Indicator?


The Momentum Indicator, or MTM, is one of the most widely used tools in technical analysis. It measures how quickly an asset's price changes over a specific period.

The principle behind momentum is similar to inertia in physics. Once a price trend is in motion, it often continues in the same direction until a significant market force causes it to slow down or reverse.

Unlike analysis methods that focus primarily on price levels, the Momentum Indicator shows whether a price movement is accelerating or losing speed. Strong momentum may support the continuation of a trend, while weakening momentum may indicate that a pullback or reversal is approaching.

The indicator can therefore help traders assess whether a trend remains strong enough to follow and identify when it may be approaching its final stage.


2. How to Use the Momentum Indicator: Three Core Methods


2.1 Zero Line Crossover Signals


When the momentum line crosses above the zero line, it indicates that upward momentum is increasing. In an established uptrend, traders may use this as a bullish reference signal.

When the momentum line crosses below the zero line, it suggests that downward momentum is strengthening. In an established downtrend, traders may interpret this as a bearish reference signal.

Crossover signals that align with the broader market trend are generally more reliable than signals that move against it.

2.2 Divergence Signals


Divergence is one of the most valuable signals provided by the Momentum Indicator.

Bearish divergence: The price reaches a new high, but the Momentum Indicator fails to reach a corresponding new high. This suggests that upward momentum is weakening and that the price may pull back.

Bullish divergence: The price reaches a new low while the Momentum Indicator begins to rise. This indicates that selling pressure may be weakening and that the price could rebound.

Divergence does not guarantee that a reversal will occur, but it can provide an early warning that the current trend is losing strength.

2.3 Overbought and Oversold Conditions


The standard Momentum Indicator does not have fixed upper or lower boundaries. Traders must therefore identify potential overbought and oversold levels by reviewing the historical behavior of each asset.

Bounded oscillators, such as the Relative Strength Index, provide standardized reference ranges and may be easier for beginners to interpret.

3. Momentum Indicator Parameter Settings


The most commonly used default period for the Momentum Indicator is 12.

A shorter period makes the indicator more responsive to recent price movements, but it may also generate more market noise and false signals. A longer period produces a smoother indicator line but responds more slowly to changes in market conditions.

Short-term traders may consider using a shorter period to increase sensitivity. Medium-term and long-term traders may prefer a longer period to filter out short-term price fluctuations.

On MEXC, users can adjust the Momentum Indicator parameters according to their trading style and compare signals across multiple timeframes.


4. Considerations When Using the Momentum Indicator


1)Avoid relying on a single indicator. The Momentum Indicator measures the speed of price movements but cannot independently identify the broader trend or important price levels. Traders should combine it with tools such as moving averages and support and resistance levels.

2)Consider the market environment. The Momentum Indicator may produce frequent false signals in sideways or range-bound markets. Momentum signals also tend to be more reliable in rising markets than in declining markets.

3)Apply appropriate risk management. Technical indicators are analytical tools, and every signal should be supported by appropriate position sizing and stop-loss rules. When trading on MEXC, users can take advantage of the platform's take-profit and stop-loss features to manage risk.

5. Common Momentum Indicators


Momentum indicators are a broad category of technical analysis tools. In addition to the standard MTM indicator, the following indicators are also widely used:

Relative Strength Index (RSI): RSI moves between 0 and 100 and measures the speed and magnitude of price changes. It is commonly used to identify overbought conditions above 70 and oversold conditions below 30.

Moving Average Convergence Divergence (MACD): MACD uses the relationship between moving averages to reflect both trend direction and momentum. Crossovers between the MACD line and the signal line are commonly used as trading reference signals.

Stochastic Oscillator (KDJ): This indicator measures the current closing price’s relative position within a selected price range. Traders commonly use it to assess potential short-term price movements.

Rate of Change (ROC): ROC moves above and below a zero line and measures the percentage change between the current price and the price from a previous period.

6. Momentum Indicator FAQ


6.1 How should I set the Momentum Indicator parameters?


The default period is usually 12. Short-term traders may use a shorter period for greater sensitivity, while medium-term and long-term traders may use a longer period to reduce market noise.

6.2 Which momentum indicator is the most accurate?


No momentum indicator is universally the most accurate. MACD is often considered a comprehensive tool for analyzing both trends and momentum, while RSI is particularly useful for identifying overbought and oversold conditions. Performance depends on the market environment and how the indicator is applied.

6.3 What are the most common momentum indicators?


Common momentum indicators include the standard Momentum Indicator, Relative Strength Index, Moving Average Convergence Divergence, Rate of Change, and Stochastic Oscillator.

6.4 Does momentum trading really work?


Momentum strategies have historically performed well in markets with clear trends. However, they may generate unreliable signals in sideways markets. Their effectiveness depends on appropriate signal filtering, market analysis, and risk management.

6.5 Is the Momentum Indicator useful?


The Momentum Indicator is a practical tool for evaluating trend strength. However, it has limitations, including the absence of fixed boundaries and less reliable signals in range-bound markets. Traders should use it together with other analytical tools.

6.6 How do I use the Momentum Indicator on MEXC?


Open the candlestick chart on the MEXC Spot or Futures trading page. Search for the Momentum Indicator in the indicators menu, add it to the chart, and customize its parameters according to your trading strategy.


Risk Disclaimer: Technical indicators are calculated using historical data and are provided for reference only. They cannot guarantee future market performance. Digital asset markets are highly volatile, and trading involves risk. Make decisions carefully based on your own risk tolerance and avoid following market trends blindly.