Buy Crypto
Markets
Spot
FuturesBTC
Earn
Event Center
Rewards Hub
More
Price Change and Range FAQPrice Change and Range FAQ
Category List
Cancel

Price Change and Range FAQ

Key Takeaways:

  • Price change shows the direction and percentage of a price movement over a given period, while range shows the extent of price fluctuations.
  • The two metrics use different calculations. Price change compares the opening and closing prices, while range uses the highest and lowest prices.
  • Price change and range can provide context for assessing market direction and volatility.
  • On MEXC, users can view real-time price change and range data on the candlestick chart.

1. Understanding Price Change and Range


1.1 What is price change?


Price change refers to the percentage increase or decrease in an asset's price over a specified period. It is commonly calculated as follows:

Price change = (Closing price − Opening price) ÷ Opening price × 100%

A positive result indicates that the price increased, while a negative result indicates that the price decreased. Traders may review price changes across different timeframes, such as daily, weekly, or yearly periods, to better understand the direction of the market.

1.2 What is range?


Range measures the extent of an asset's price fluctuations over a specified period. It is also expressed as a percentage and can be calculated as follows:

Range = (Highest price − Lowest price) ÷ Current price × 100%

A higher range indicates a wider price range and greater market volatility. A lower range indicates a narrower price range and may occur when the market is consolidating.

1.3 What is the difference between price change and range?


The main difference is what each metric measures:
  • Price change measures direction: It shows whether the price increased or decreased over the period and by how much.
  • Range measures fluctuation: It shows the range within which the price moved and can provide context about volatility and market activity.

For example, a cryptocurrency may open and close at nearly the same price, resulting in a price change close to zero. However, if the price rose sharply and then fell significantly during the same period, its range could exceed 10%.

In this case, price change alone may suggest limited movement, while range shows that substantial intraday volatility occurred. Reviewing both metrics can provide a more complete view of market activity.

1.4 How are price change and range calculated?


Consider the following Bitcoin price data:
  • Opening price: 112,925.44
  • Closing price: 113,137.63
  • Highest price: 113,253.68
  • Lowest price: 112,925.44

Price change:
(113,137.63 − 112,925.44) ÷ 112,925.44 × 100% ≈ 0.188%
Range:
(113,253.68 − 112,925.44) ÷ 113,137.63 × 100% ≈ 0.2901%

In this example, Bitcoin recorded a modest price increase and a relatively narrow trading range during the period.

2. Using Price Change and Range Data


2.1 What can price change and range data be used for?


Price change and range can provide context in three main areas:
  • Market trend analysis: Reviewing changes in price and range across different timeframes can help traders assess whether the market is trending upward, trending downward, or consolidating.
  • Risk management: Range can provide context about recent volatility when traders set stop-loss and take-profit levels.
  • Trading analysis: Traders may use these metrics alongside other tools when evaluating potential entry or exit opportunities. When range is unusually high, they may remain cautious and avoid impulsive trading decisions.

2.2 How can range help traders set stop-loss and take-profit levels?


Range can provide a reference for an asset's recent trading range. In a high-range market, traders may consider allowing more room between the entry price and the stop-loss level to account for normal price fluctuations.

Take-profit targets may also be assessed with reference to recent average range. However, range should not be used alone when setting stop-loss or take-profit levels. Price structure, position size, and individual risk tolerance should also be considered.

2.3 How are price change and range used across different timeframes?


Shorter timeframes, such as daily charts, can help short-term traders review recent price movements. Longer timeframes, such as weekly or monthly charts, can provide broader context about medium-term and long-term market conditions.

Beginners may consider starting with longer timeframes to reduce the influence of short-term market noise.

3. How to View Price Change and Range Data on MEXC


MEXC provides price change and range data for both Spot and Futures markets. The process is generally the same:
1)Log in to your account: Log in to your MEXC account.
2)Open the Spot trading page: Select Spot from the homepage or navigation menu.
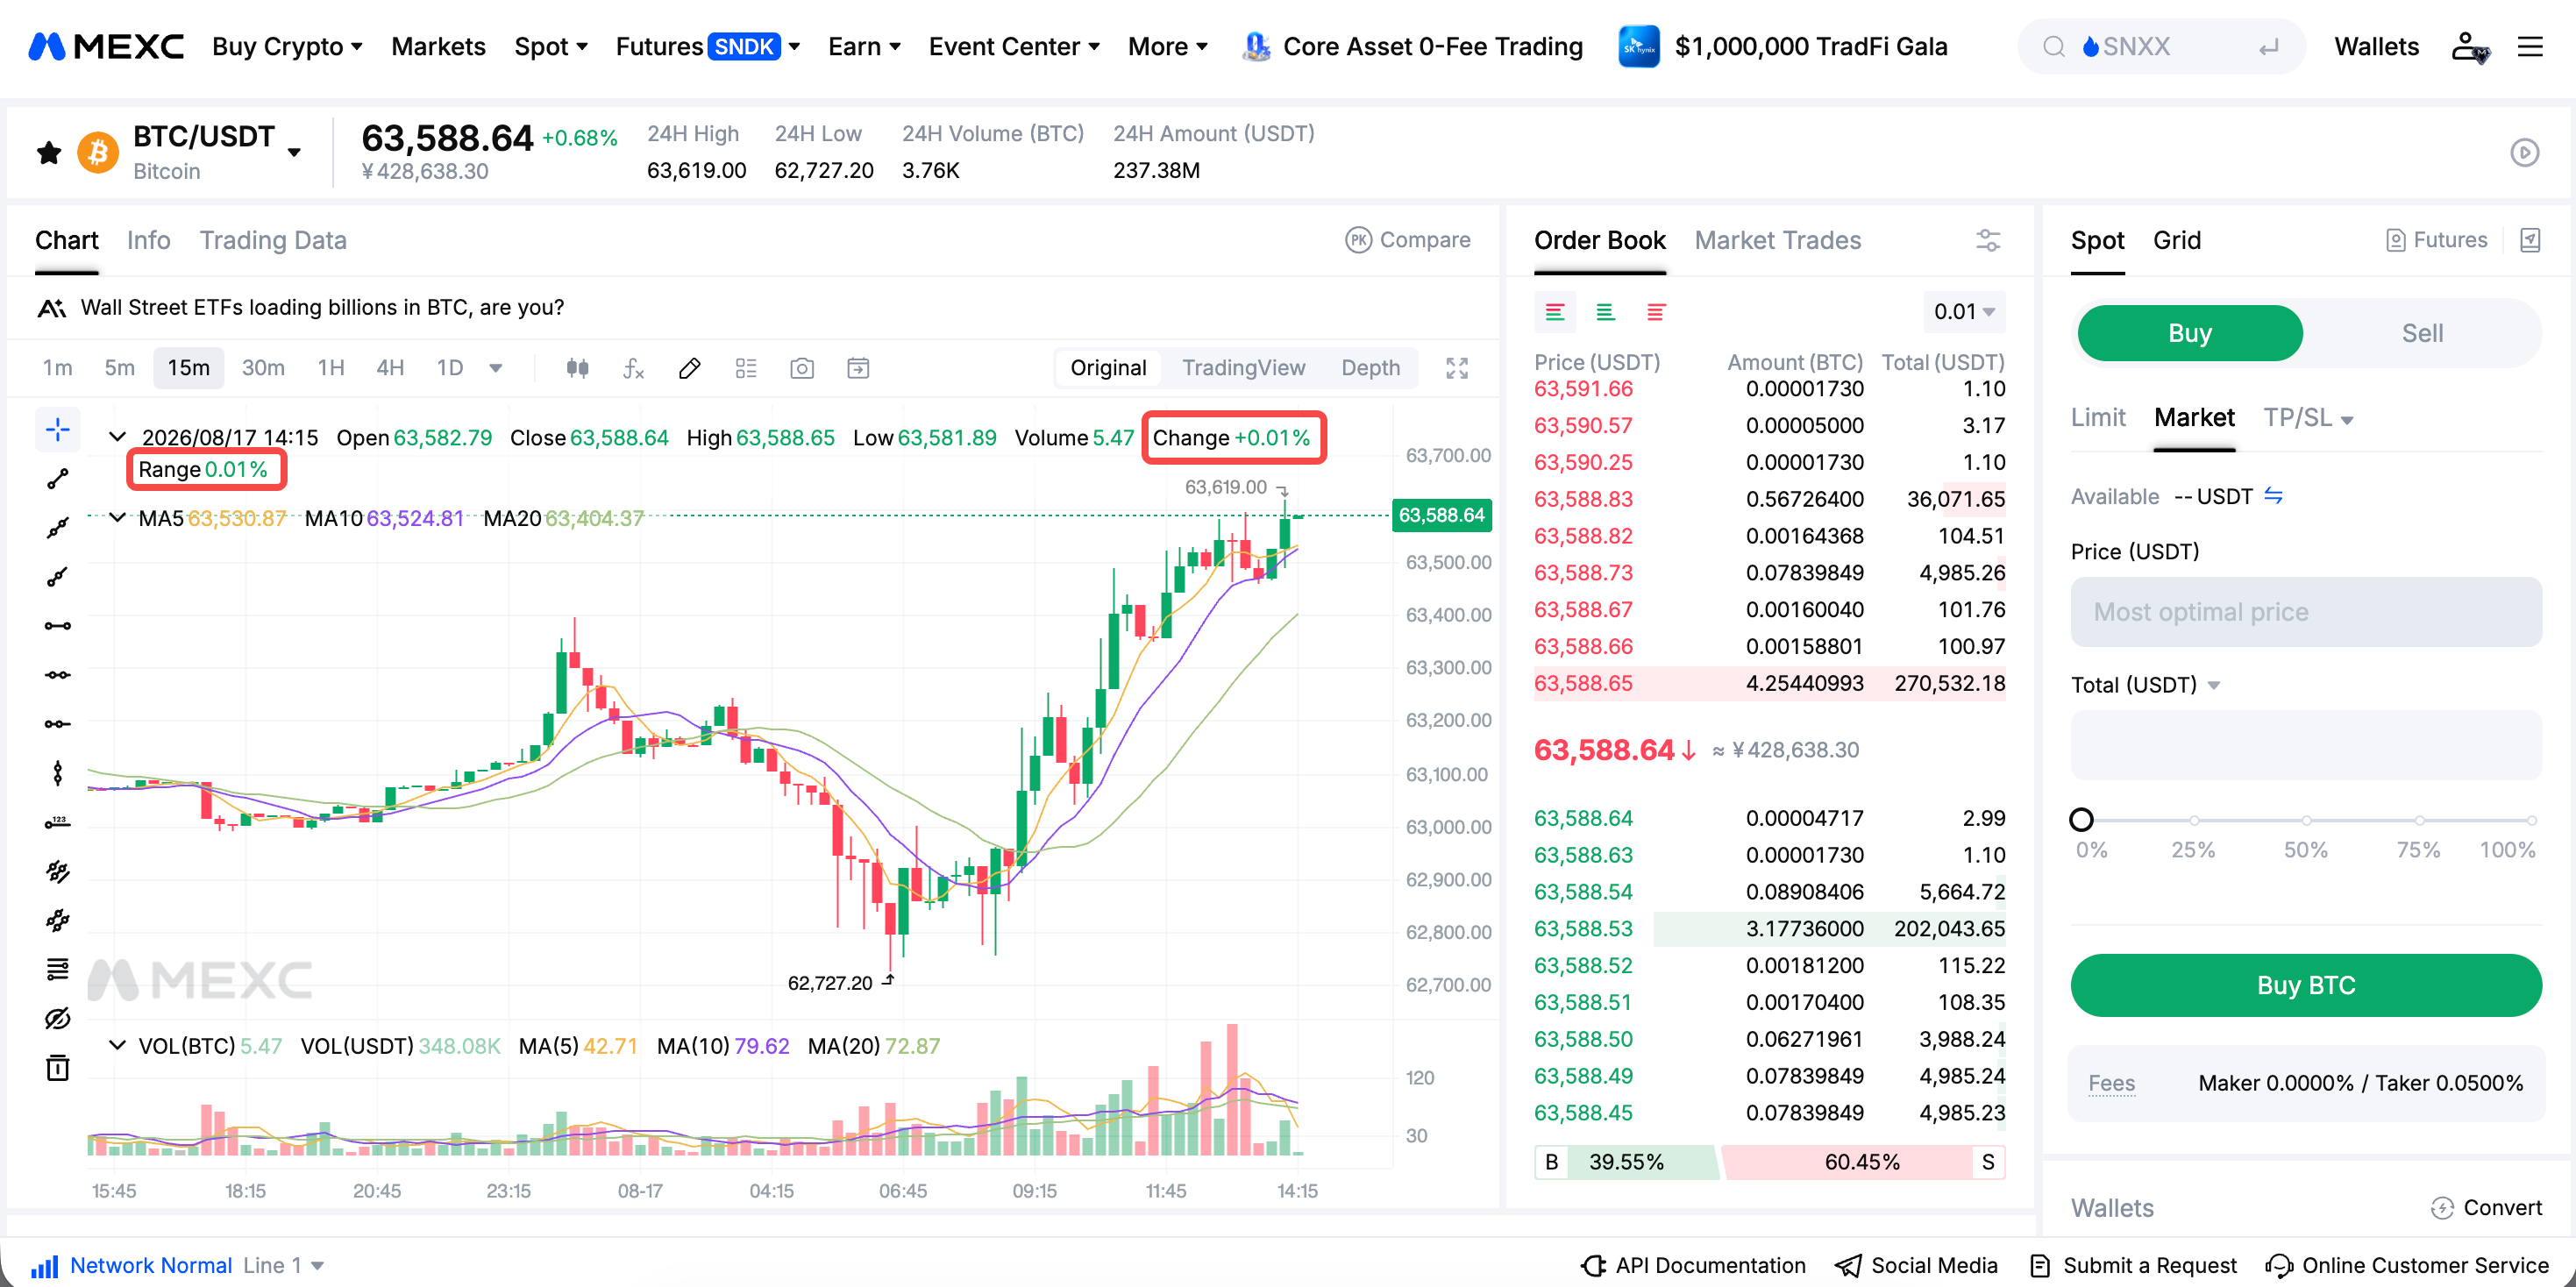
3)Open the candlestick chart: View the candlestick chart on the trading page to review the asset's price movements.
4)View the data: Price change and range percentages are displayed above the chart, allowing you to review current market activity.


4. Price Change and Range in Trading


4.1 Does a large price increase guarantee a profit?


No. A large price increase only shows that the asset's price rose significantly during a given period. Entering at an unfavorable time may still result in a loss.

Traders should consider market trends, trading volume, and other relevant data instead of making decisions based only on price change.

4.2 Does a high range mean higher returns?


No. A high range indicates wider price fluctuations, which may create both opportunities and risks. Traders should consider their risk tolerance and apply appropriate risk management when trading in highly volatile markets.

4.3 Should beginners focus more on price change or range?


Both metrics can provide useful context. Price change helps traders assess market direction, while range helps them understand the extent of price fluctuations. Reviewing only one metric may provide an incomplete view of market conditions.

4.4 What does it mean when price change is close to zero but range is high?


This may indicate that buyers and sellers were actively competing during the period. The price may have moved significantly in both directions before closing near its opening level.

Such conditions may involve a greater risk of false breakouts. Traders may consider waiting for additional confirmation before entering a position.

4.5 Can you trade when range is low and the market is moving sideways?


Yes. Some traders use range-trading strategies in sideways markets, such as buying near support and selling near resistance.

However, a narrow range may offer limited profit potential, and the price may eventually break out of the range. Stop-loss orders and other risk management measures should still be considered.

Price change provides information about market direction, while range provides context about the extent of price fluctuations. Used together, they can offer a broader view of market activity.


Price Change and Range FAQ

Key Takeaways:

  • Price change shows the direction and percentage of a price movement over a given period, while range shows the extent of price fluctuations.
  • The two metrics use different calculations. Price change compares the opening and closing prices, while range uses the highest and lowest prices.
  • Price change and range can provide context for assessing market direction and volatility.
  • On MEXC, users can view real-time price change and range data on the candlestick chart.

1. Understanding Price Change and Range


1.1 What is price change?


Price change refers to the percentage increase or decrease in an asset's price over a specified period. It is commonly calculated as follows:

Price change = (Closing price − Opening price) ÷ Opening price × 100%

A positive result indicates that the price increased, while a negative result indicates that the price decreased. Traders may review price changes across different timeframes, such as daily, weekly, or yearly periods, to better understand the direction of the market.

1.2 What is range?


Range measures the extent of an asset's price fluctuations over a specified period. It is also expressed as a percentage and can be calculated as follows:

Range = (Highest price − Lowest price) ÷ Current price × 100%

A higher range indicates a wider price range and greater market volatility. A lower range indicates a narrower price range and may occur when the market is consolidating.

1.3 What is the difference between price change and range?


The main difference is what each metric measures:
  • Price change measures direction: It shows whether the price increased or decreased over the period and by how much.
  • Range measures fluctuation: It shows the range within which the price moved and can provide context about volatility and market activity.

For example, a cryptocurrency may open and close at nearly the same price, resulting in a price change close to zero. However, if the price rose sharply and then fell significantly during the same period, its range could exceed 10%.

In this case, price change alone may suggest limited movement, while range shows that substantial intraday volatility occurred. Reviewing both metrics can provide a more complete view of market activity.

1.4 How are price change and range calculated?


Consider the following Bitcoin price data:
  • Opening price: 112,925.44
  • Closing price: 113,137.63
  • Highest price: 113,253.68
  • Lowest price: 112,925.44

Price change:
(113,137.63 − 112,925.44) ÷ 112,925.44 × 100% ≈ 0.188%
Range:
(113,253.68 − 112,925.44) ÷ 113,137.63 × 100% ≈ 0.2901%

In this example, Bitcoin recorded a modest price increase and a relatively narrow trading range during the period.

2. Using Price Change and Range Data


2.1 What can price change and range data be used for?


Price change and range can provide context in three main areas:
  • Market trend analysis: Reviewing changes in price and range across different timeframes can help traders assess whether the market is trending upward, trending downward, or consolidating.
  • Risk management: Range can provide context about recent volatility when traders set stop-loss and take-profit levels.
  • Trading analysis: Traders may use these metrics alongside other tools when evaluating potential entry or exit opportunities. When range is unusually high, they may remain cautious and avoid impulsive trading decisions.

2.2 How can range help traders set stop-loss and take-profit levels?


Range can provide a reference for an asset's recent trading range. In a high-range market, traders may consider allowing more room between the entry price and the stop-loss level to account for normal price fluctuations.

Take-profit targets may also be assessed with reference to recent average range. However, range should not be used alone when setting stop-loss or take-profit levels. Price structure, position size, and individual risk tolerance should also be considered.

2.3 How are price change and range used across different timeframes?


Shorter timeframes, such as daily charts, can help short-term traders review recent price movements. Longer timeframes, such as weekly or monthly charts, can provide broader context about medium-term and long-term market conditions.

Beginners may consider starting with longer timeframes to reduce the influence of short-term market noise.

3. How to View Price Change and Range Data on MEXC


MEXC provides price change and range data for both Spot and Futures markets. The process is generally the same:
1)Log in to your account: Log in to your MEXC account.
2)Open the Spot trading page: Select Spot from the homepage or navigation menu.
3)Open the candlestick chart: View the candlestick chart on the trading page to review the asset's price movements.
4)View the data: Price change and range percentages are displayed above the chart, allowing you to review current market activity.


4. Price Change and Range in Trading


4.1 Does a large price increase guarantee a profit?


No. A large price increase only shows that the asset's price rose significantly during a given period. Entering at an unfavorable time may still result in a loss.

Traders should consider market trends, trading volume, and other relevant data instead of making decisions based only on price change.

4.2 Does a high range mean higher returns?


No. A high range indicates wider price fluctuations, which may create both opportunities and risks. Traders should consider their risk tolerance and apply appropriate risk management when trading in highly volatile markets.

4.3 Should beginners focus more on price change or range?


Both metrics can provide useful context. Price change helps traders assess market direction, while range helps them understand the extent of price fluctuations. Reviewing only one metric may provide an incomplete view of market conditions.

4.4 What does it mean when price change is close to zero but range is high?


This may indicate that buyers and sellers were actively competing during the period. The price may have moved significantly in both directions before closing near its opening level.

Such conditions may involve a greater risk of false breakouts. Traders may consider waiting for additional confirmation before entering a position.

4.5 Can you trade when range is low and the market is moving sideways?


Yes. Some traders use range-trading strategies in sideways markets, such as buying near support and selling near resistance.

However, a narrow range may offer limited profit potential, and the price may eventually break out of the range. Stop-loss orders and other risk management measures should still be considered.

Price change provides information about market direction, while range provides context about the extent of price fluctuations. Used together, they can offer a broader view of market activity.